In this useful overview, we will explain how to understand the results of your Local Search Grid report.
If you prefer to learn by watching videos, check out our free course in BrightLocal Academy that shows you how to set up and understand a Local Search Grid report ?
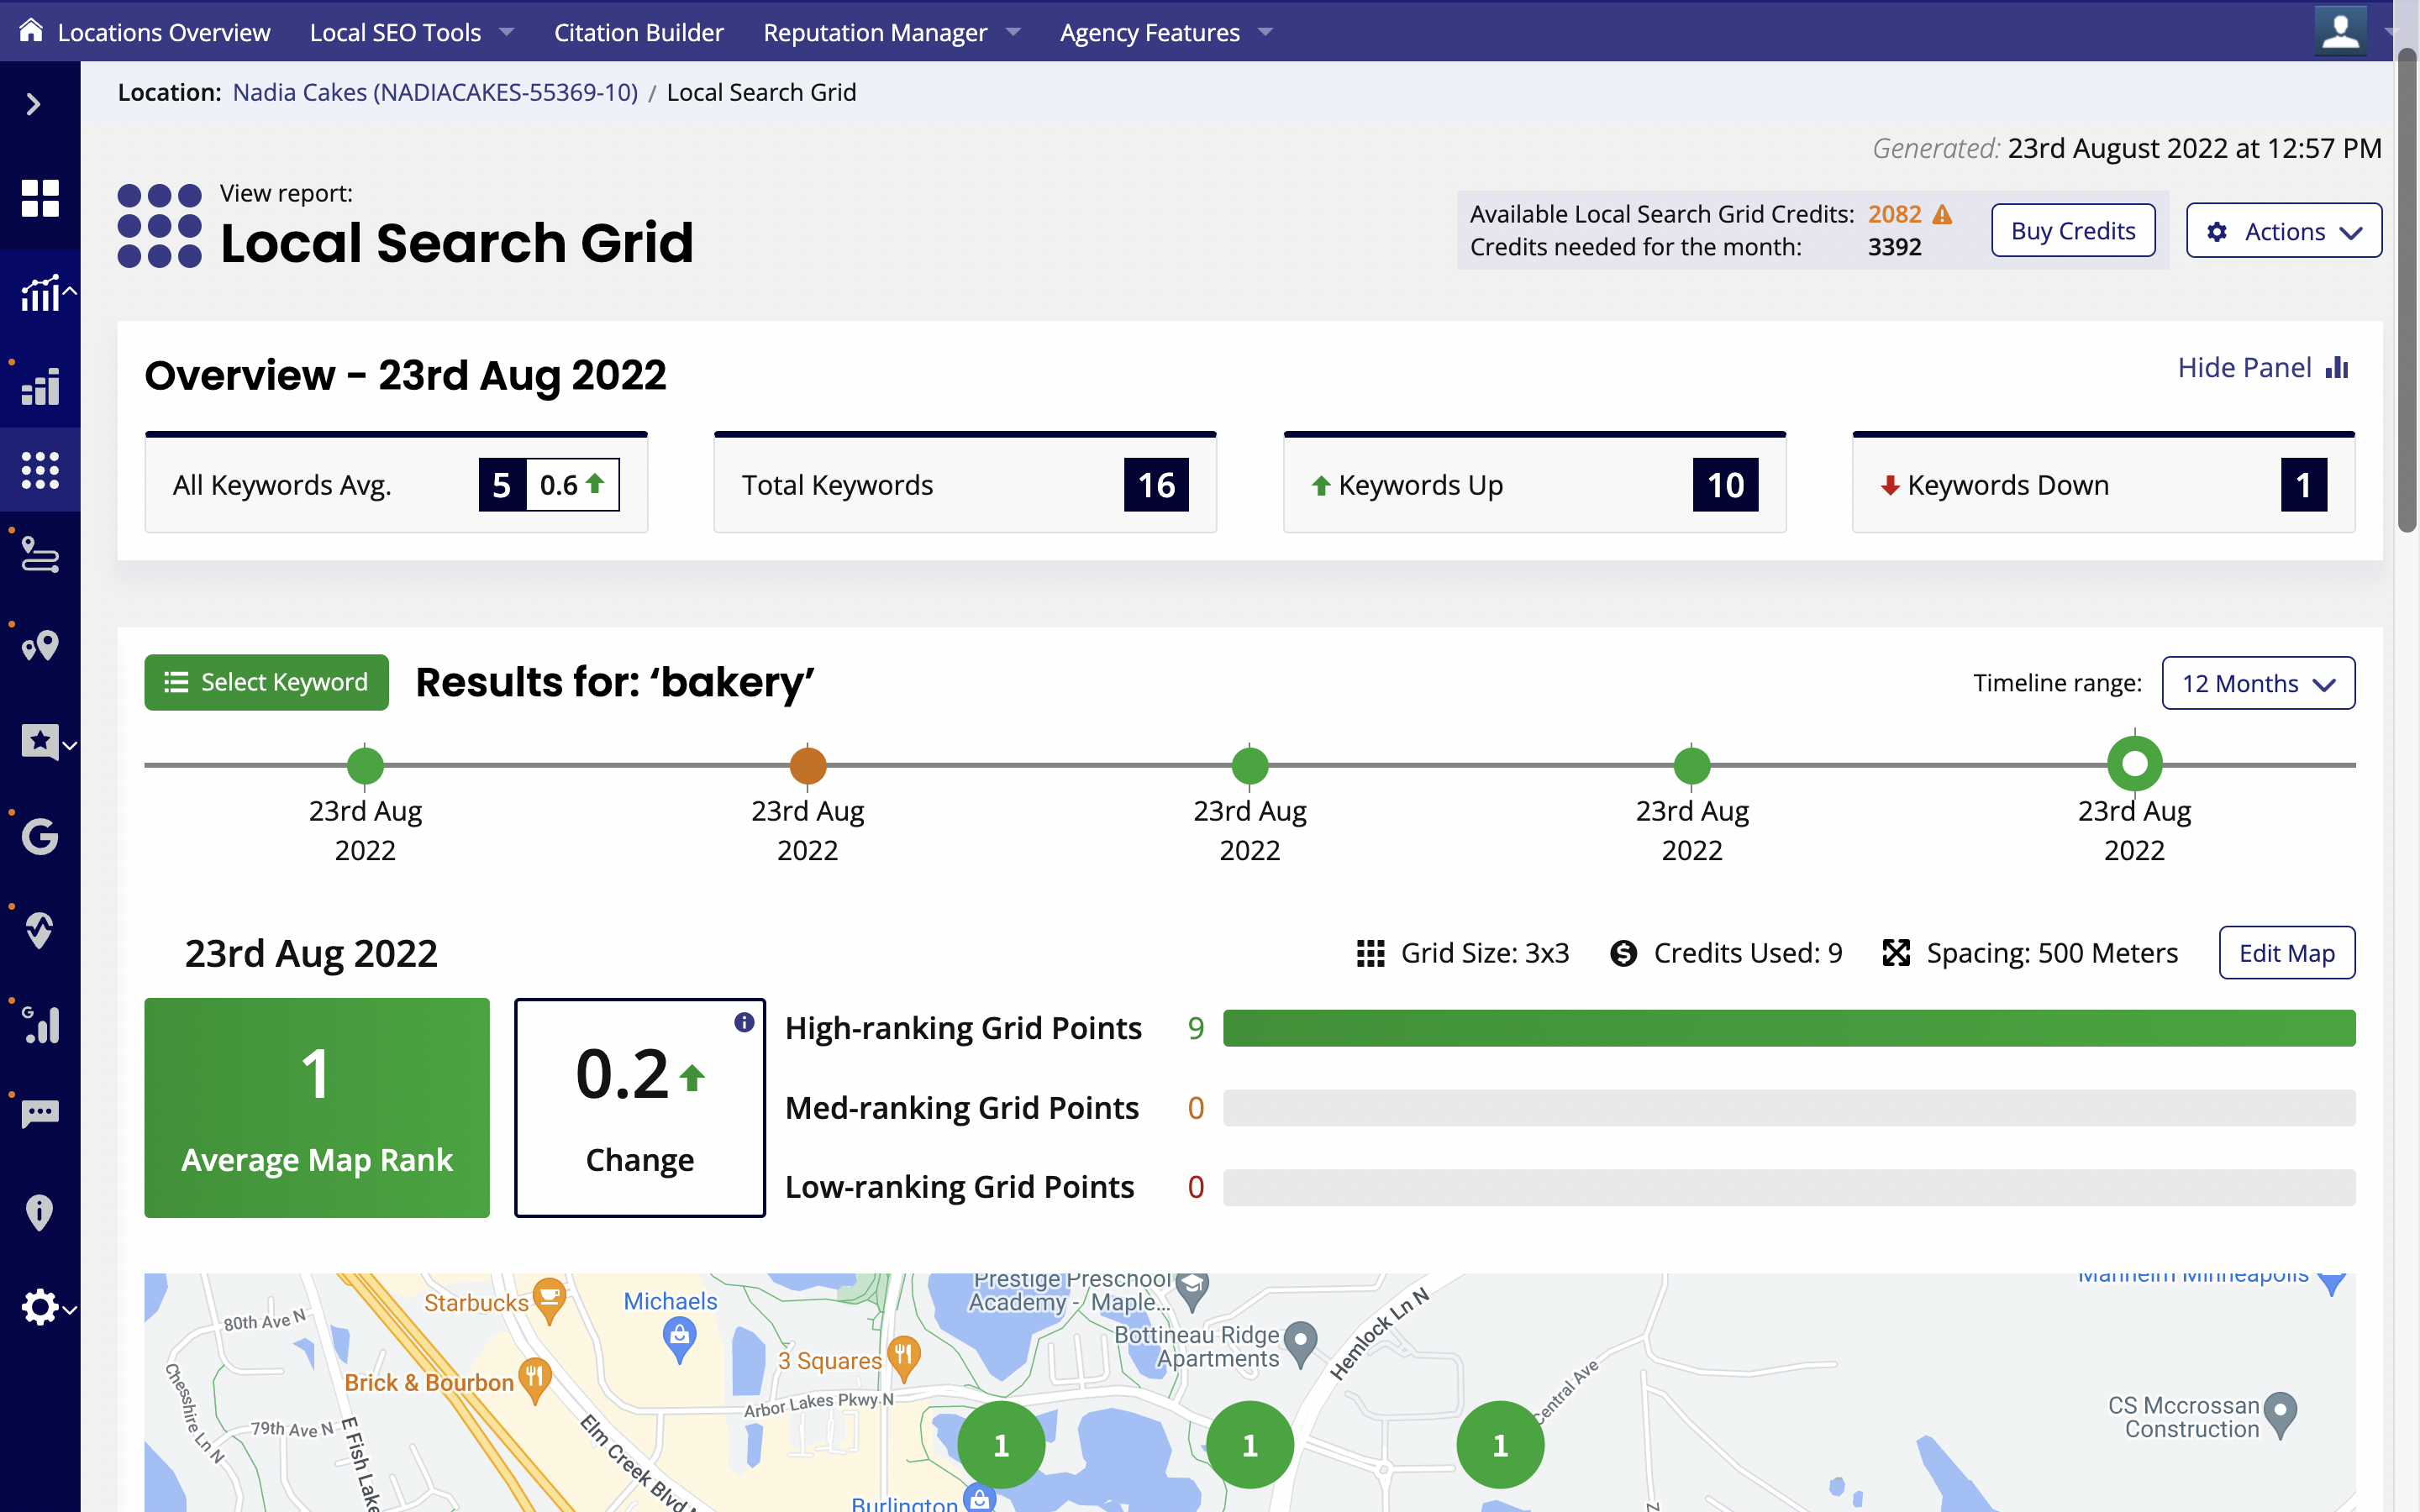
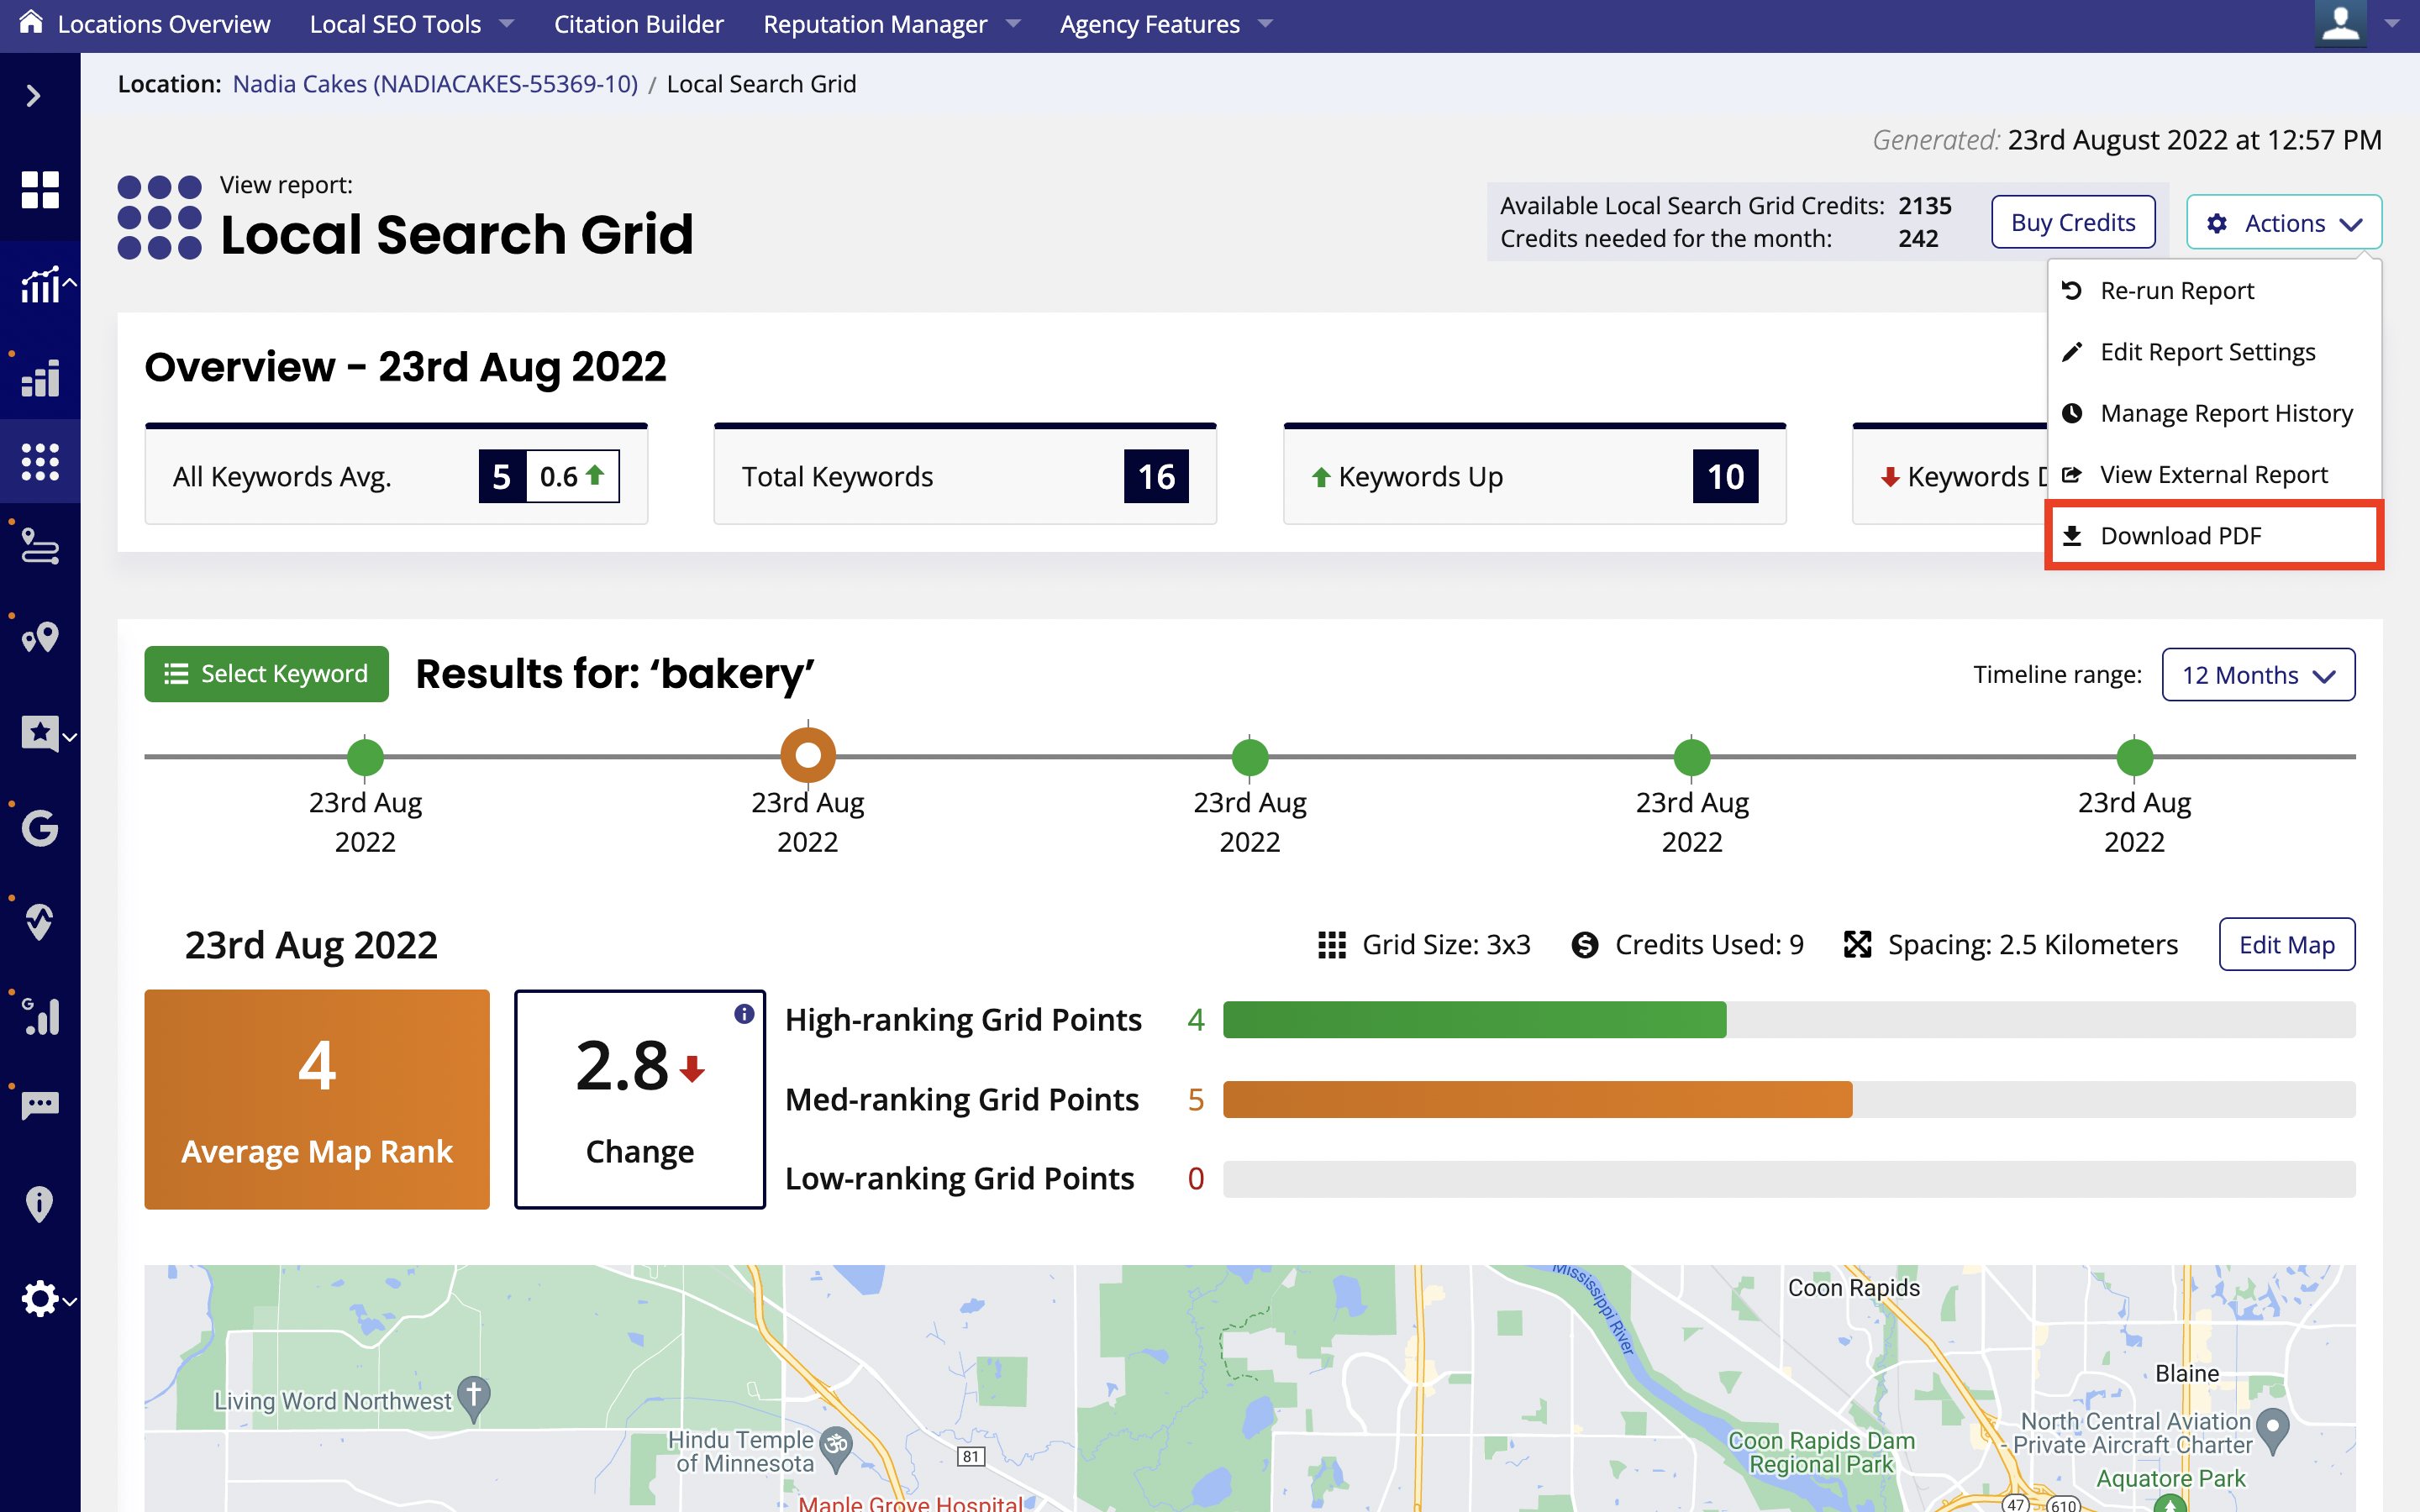
A Local Search Grid report will look like this, once complete:
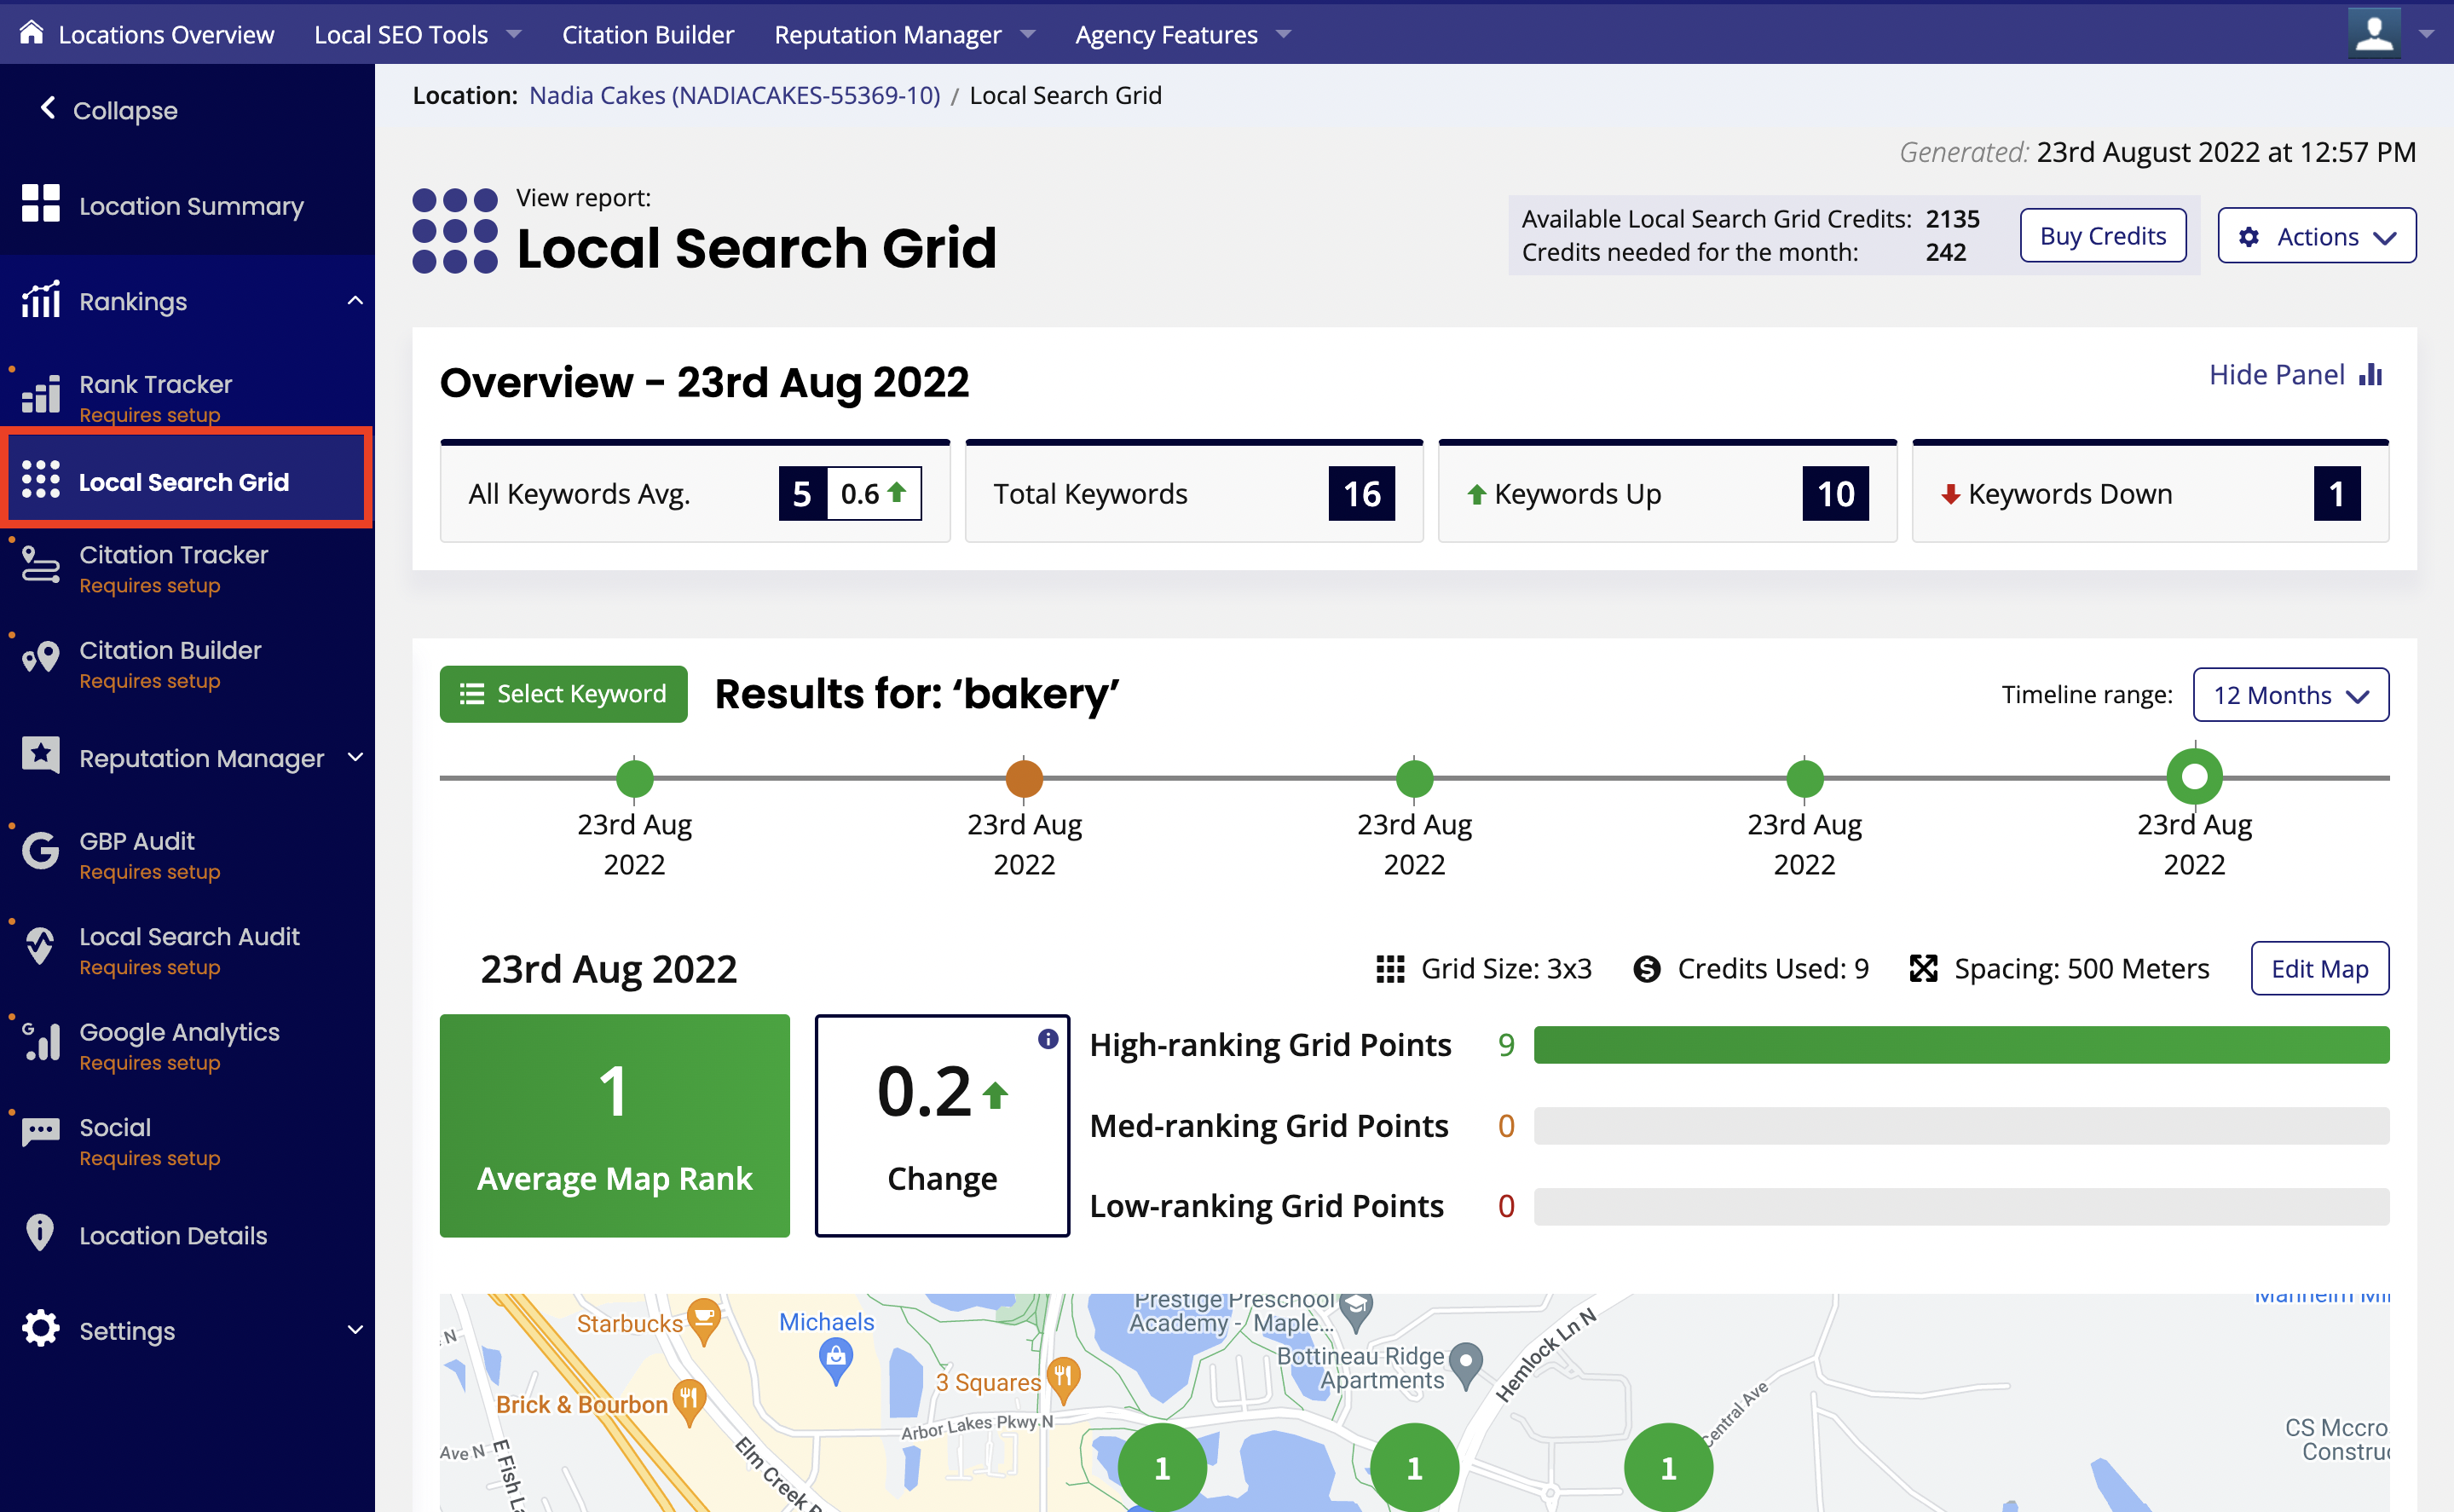
You can find the report by clicking 'SEO Tools' in the top navigation bar, then selecting 'Local Search Grid'. It is also accessible from the Location’s sidebar menu, as shown below.

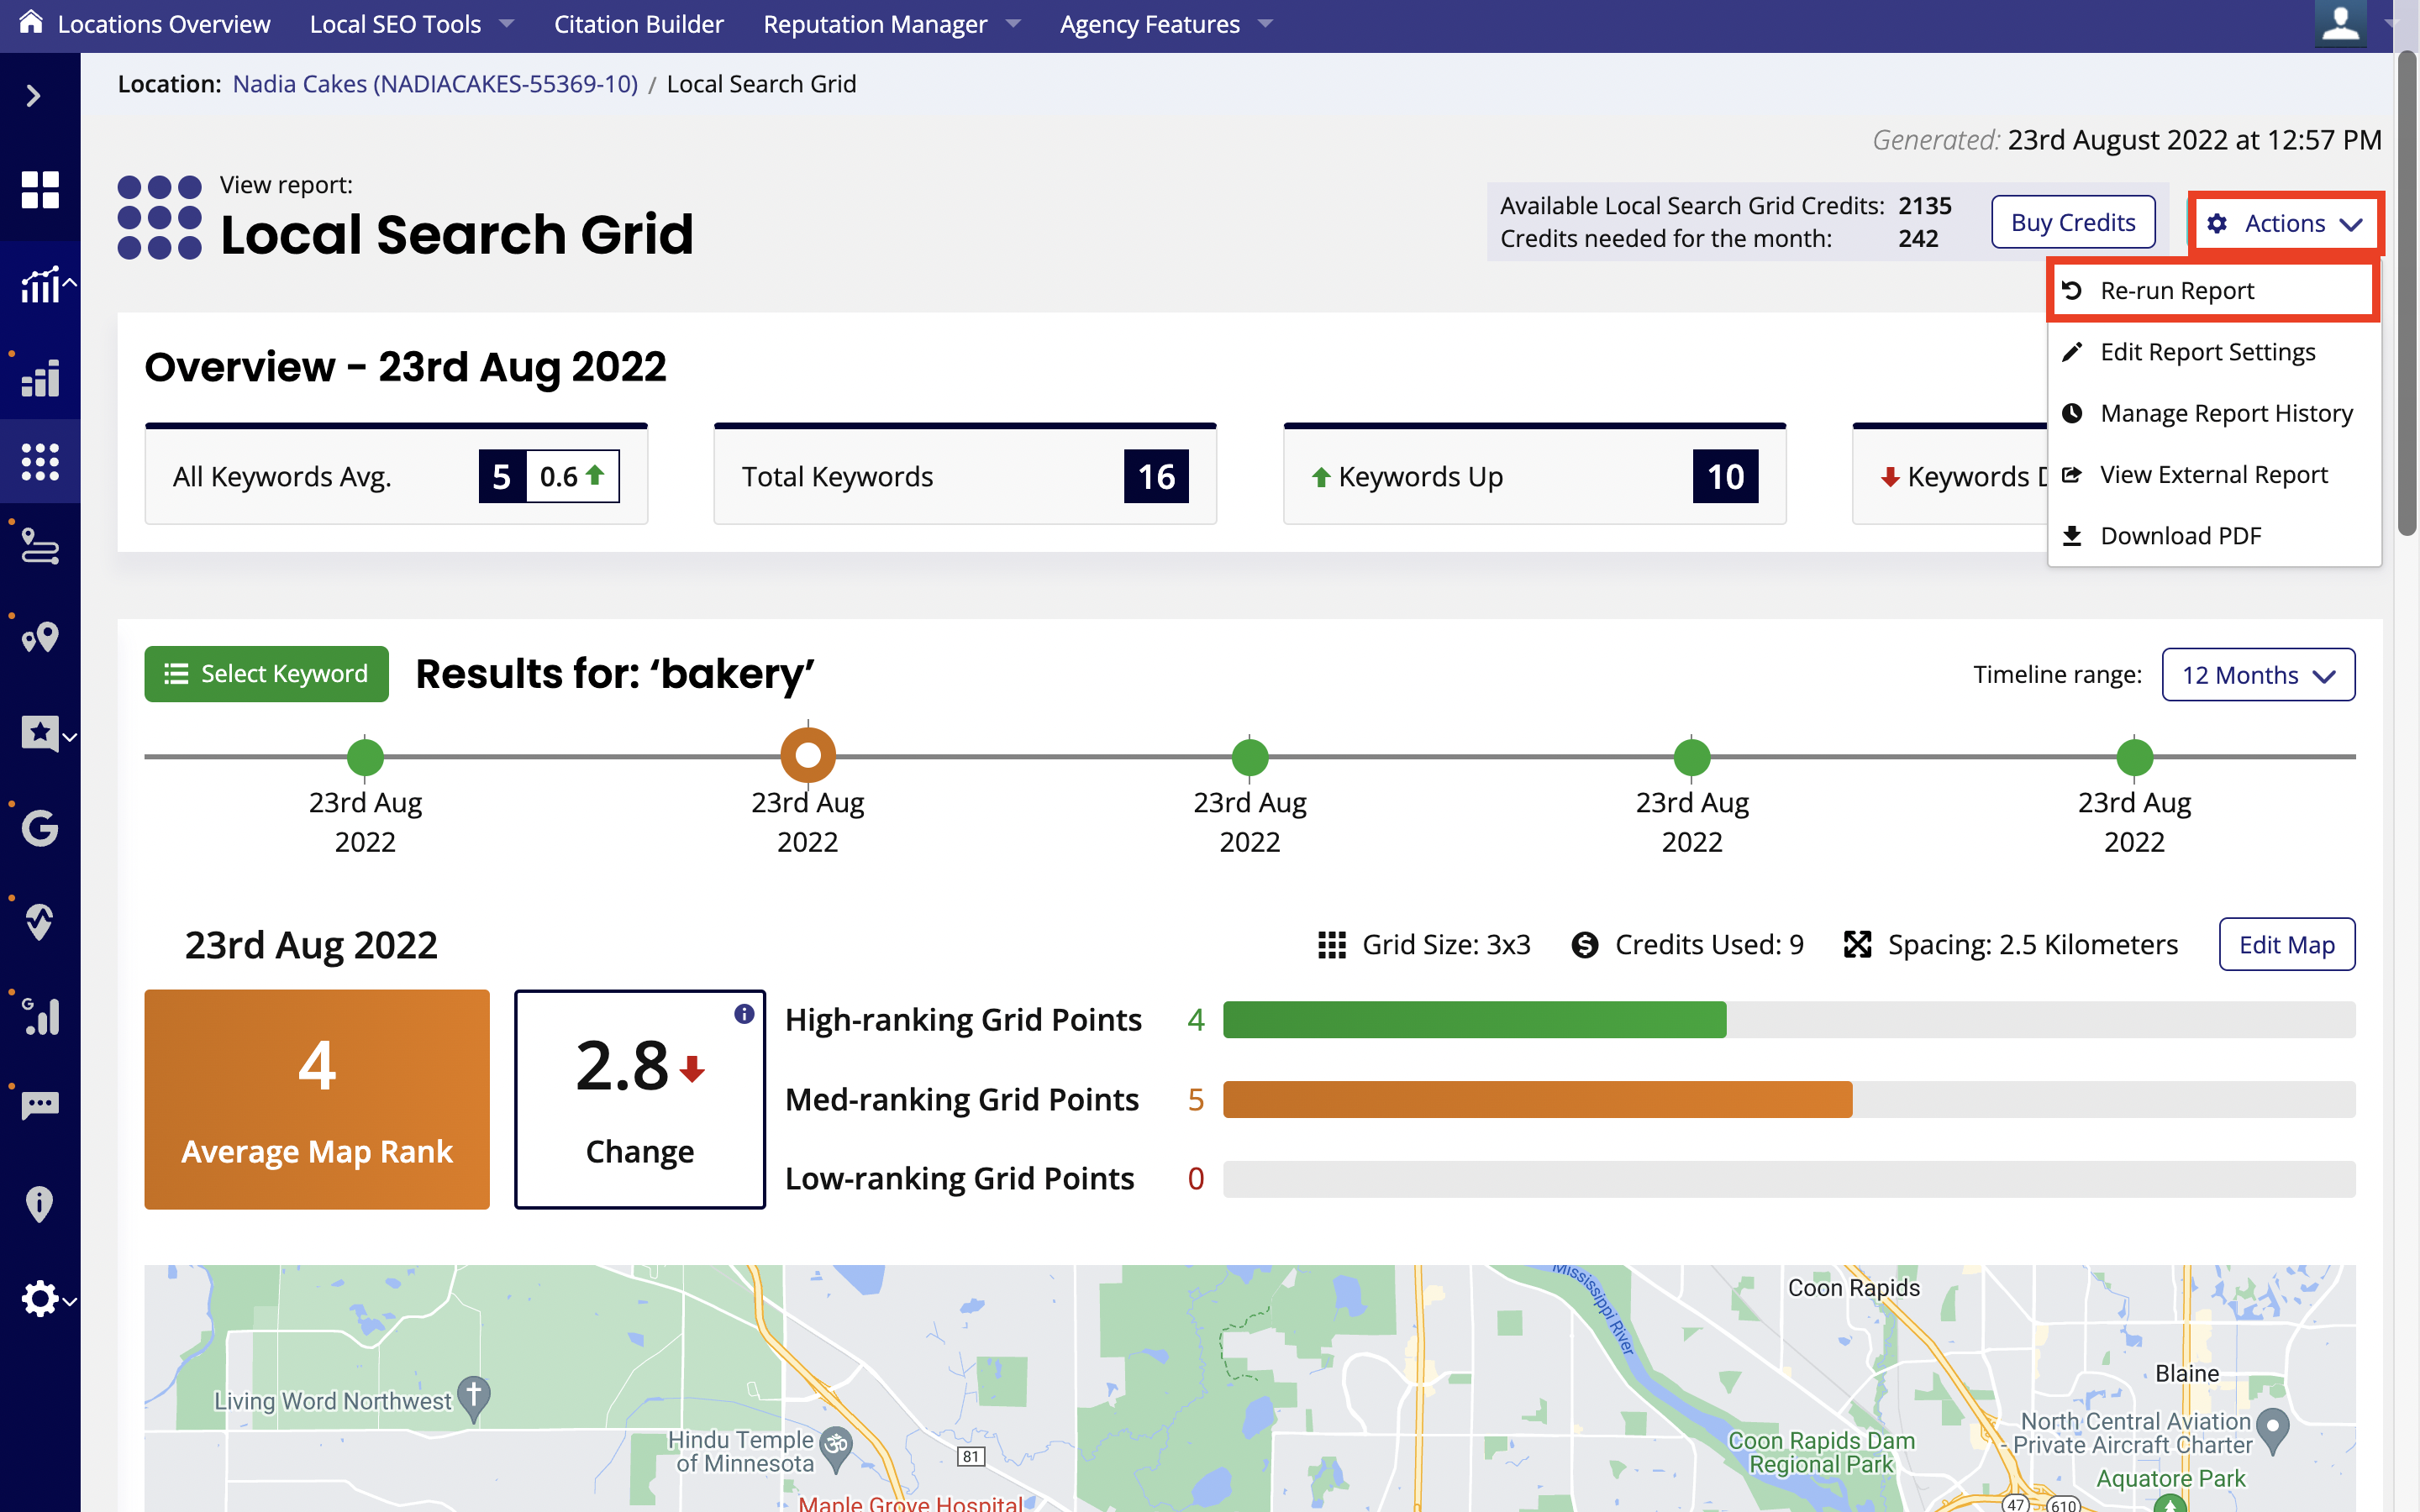
Once opened, you will see an overview of the report with some overall metrics.
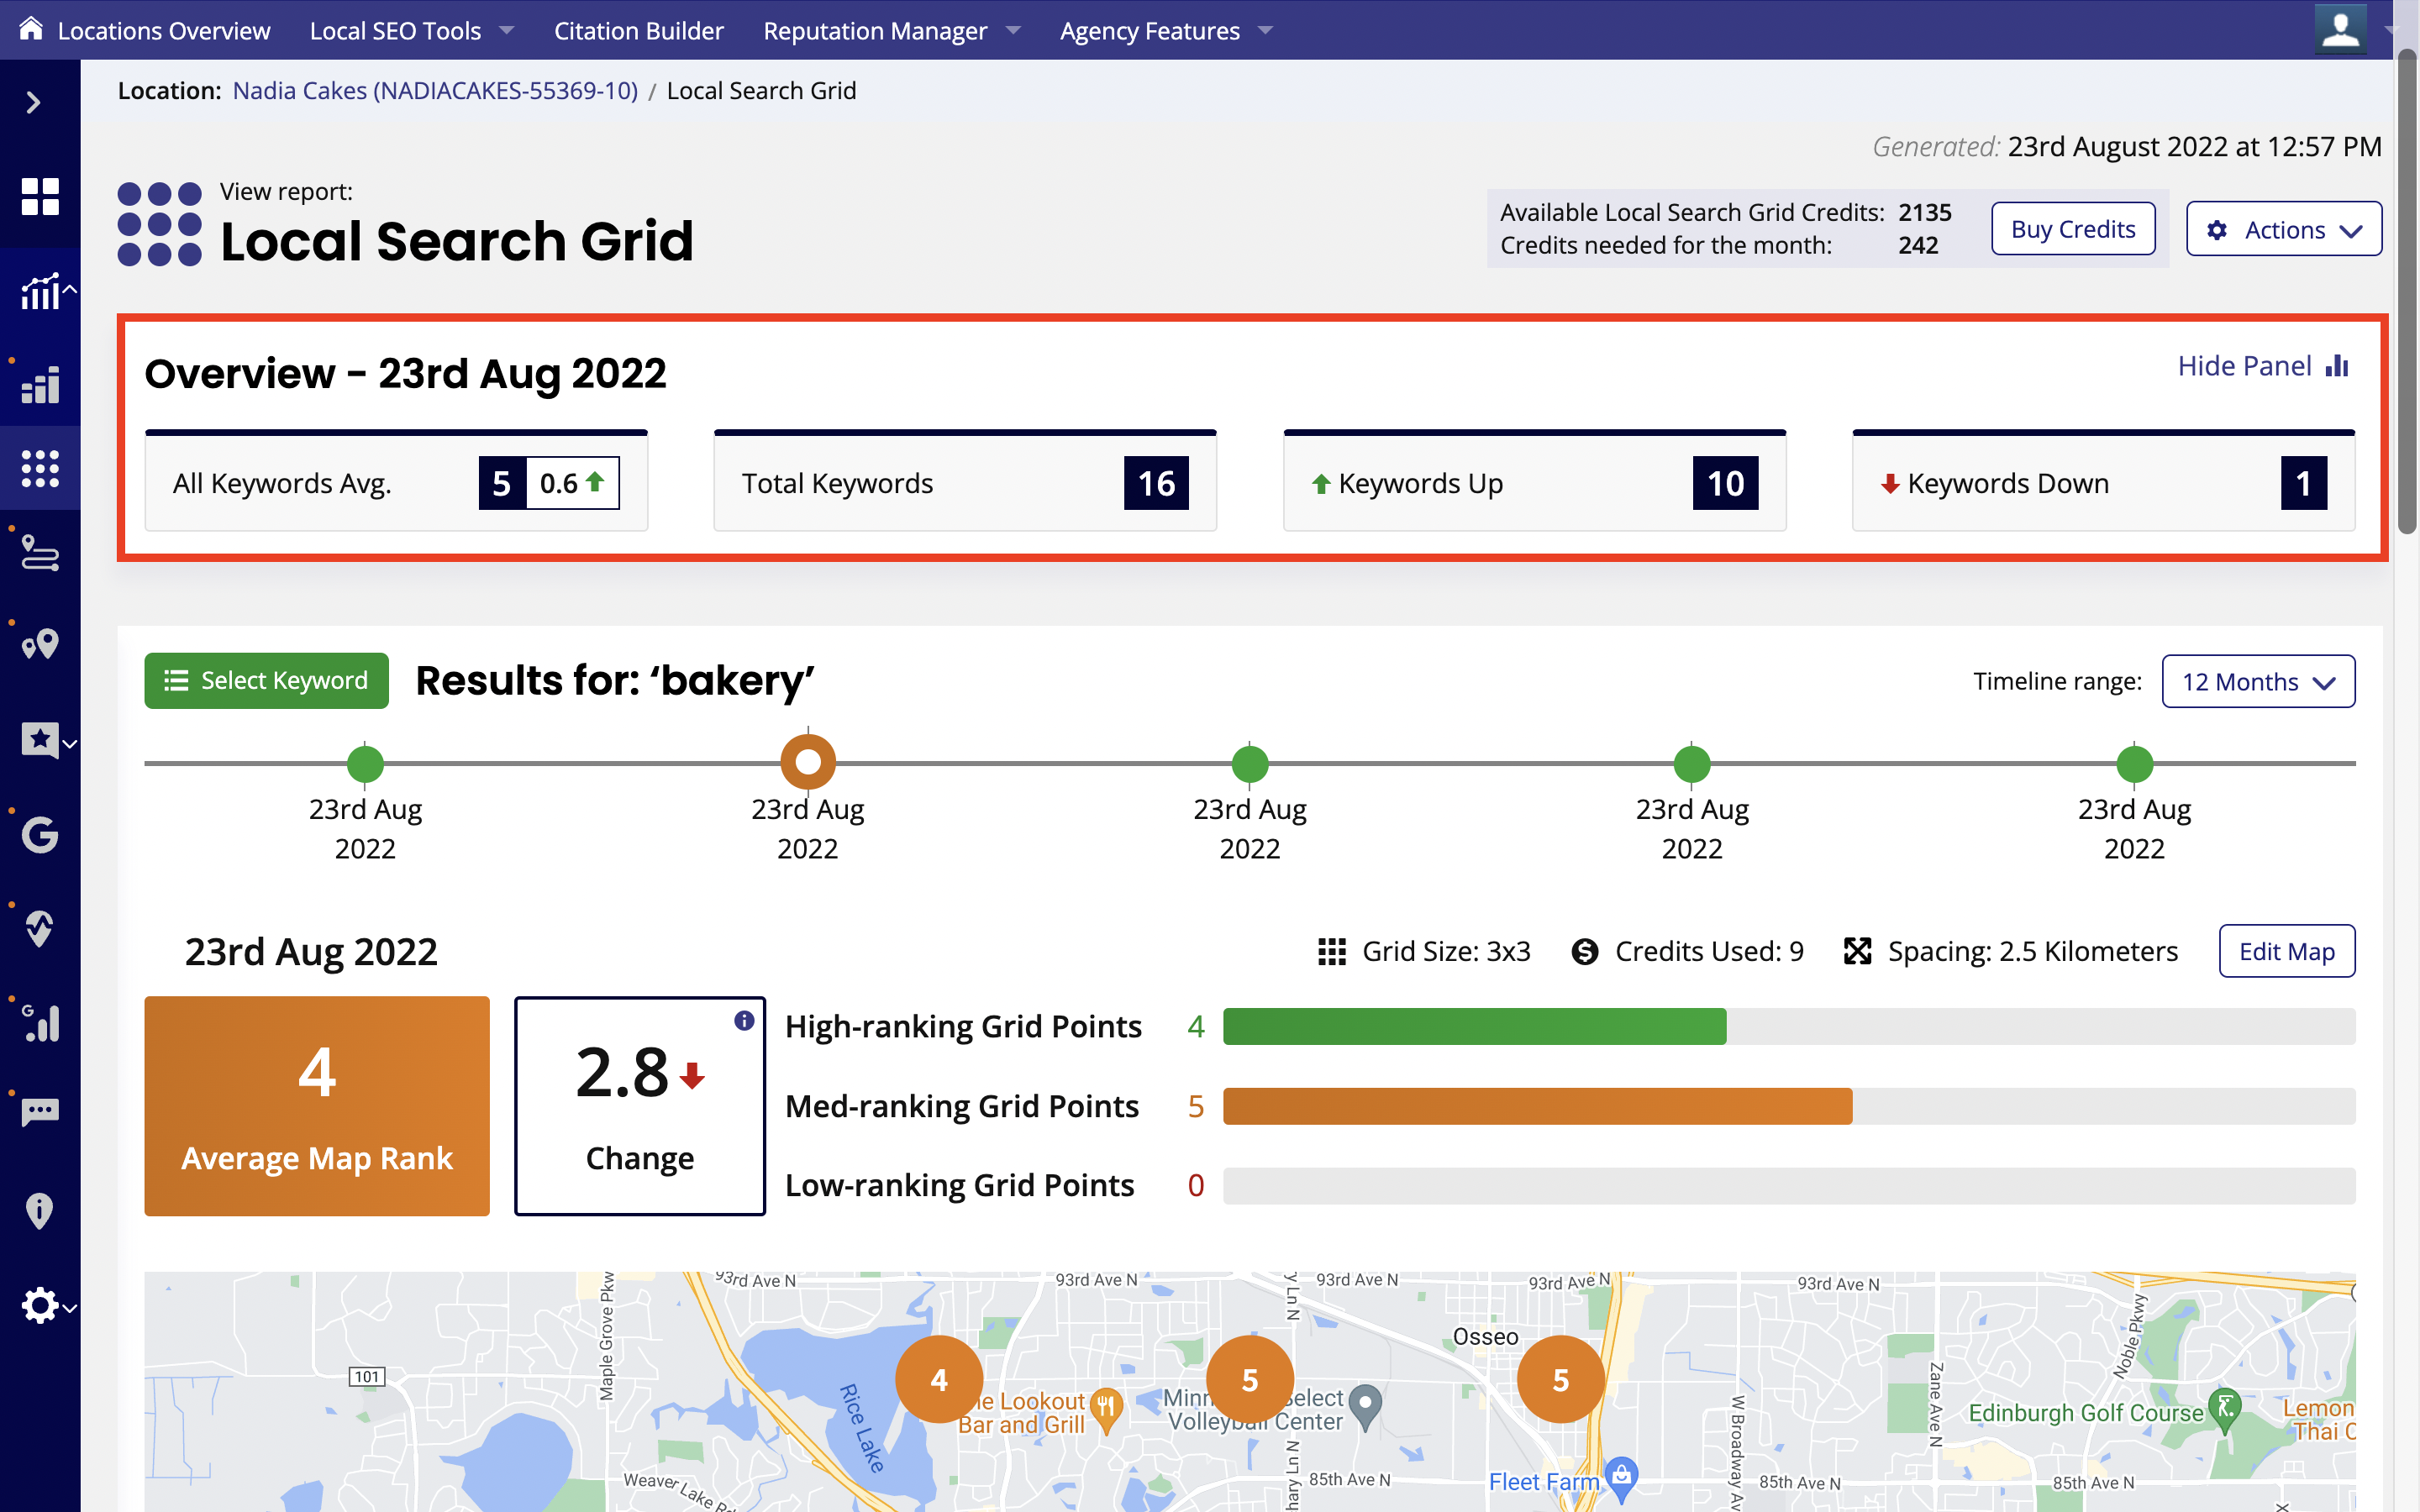
All Keywords Avg. - This takes the Avearge Map Rank across all keywords you're tracking and calculates the average. Alongside this, you'll also see the change in average keyword rankings from the previous report run. Both of these metrics help you to easily see if a business's keyword rankings have slipped and possibly need your attention.
Total Keywords - This is the total number of keywords the report is tracking.
Keywords Up - This is the total number of keywords that have increased in rankings since the last report run.
Keywords Down - This is the total number of keywords that have decreased in rankings since the last report run.
To see which keywords the report is tracking, click the 'Select Keyword' button where you can get a breakdown of how each individual keyword is performing.
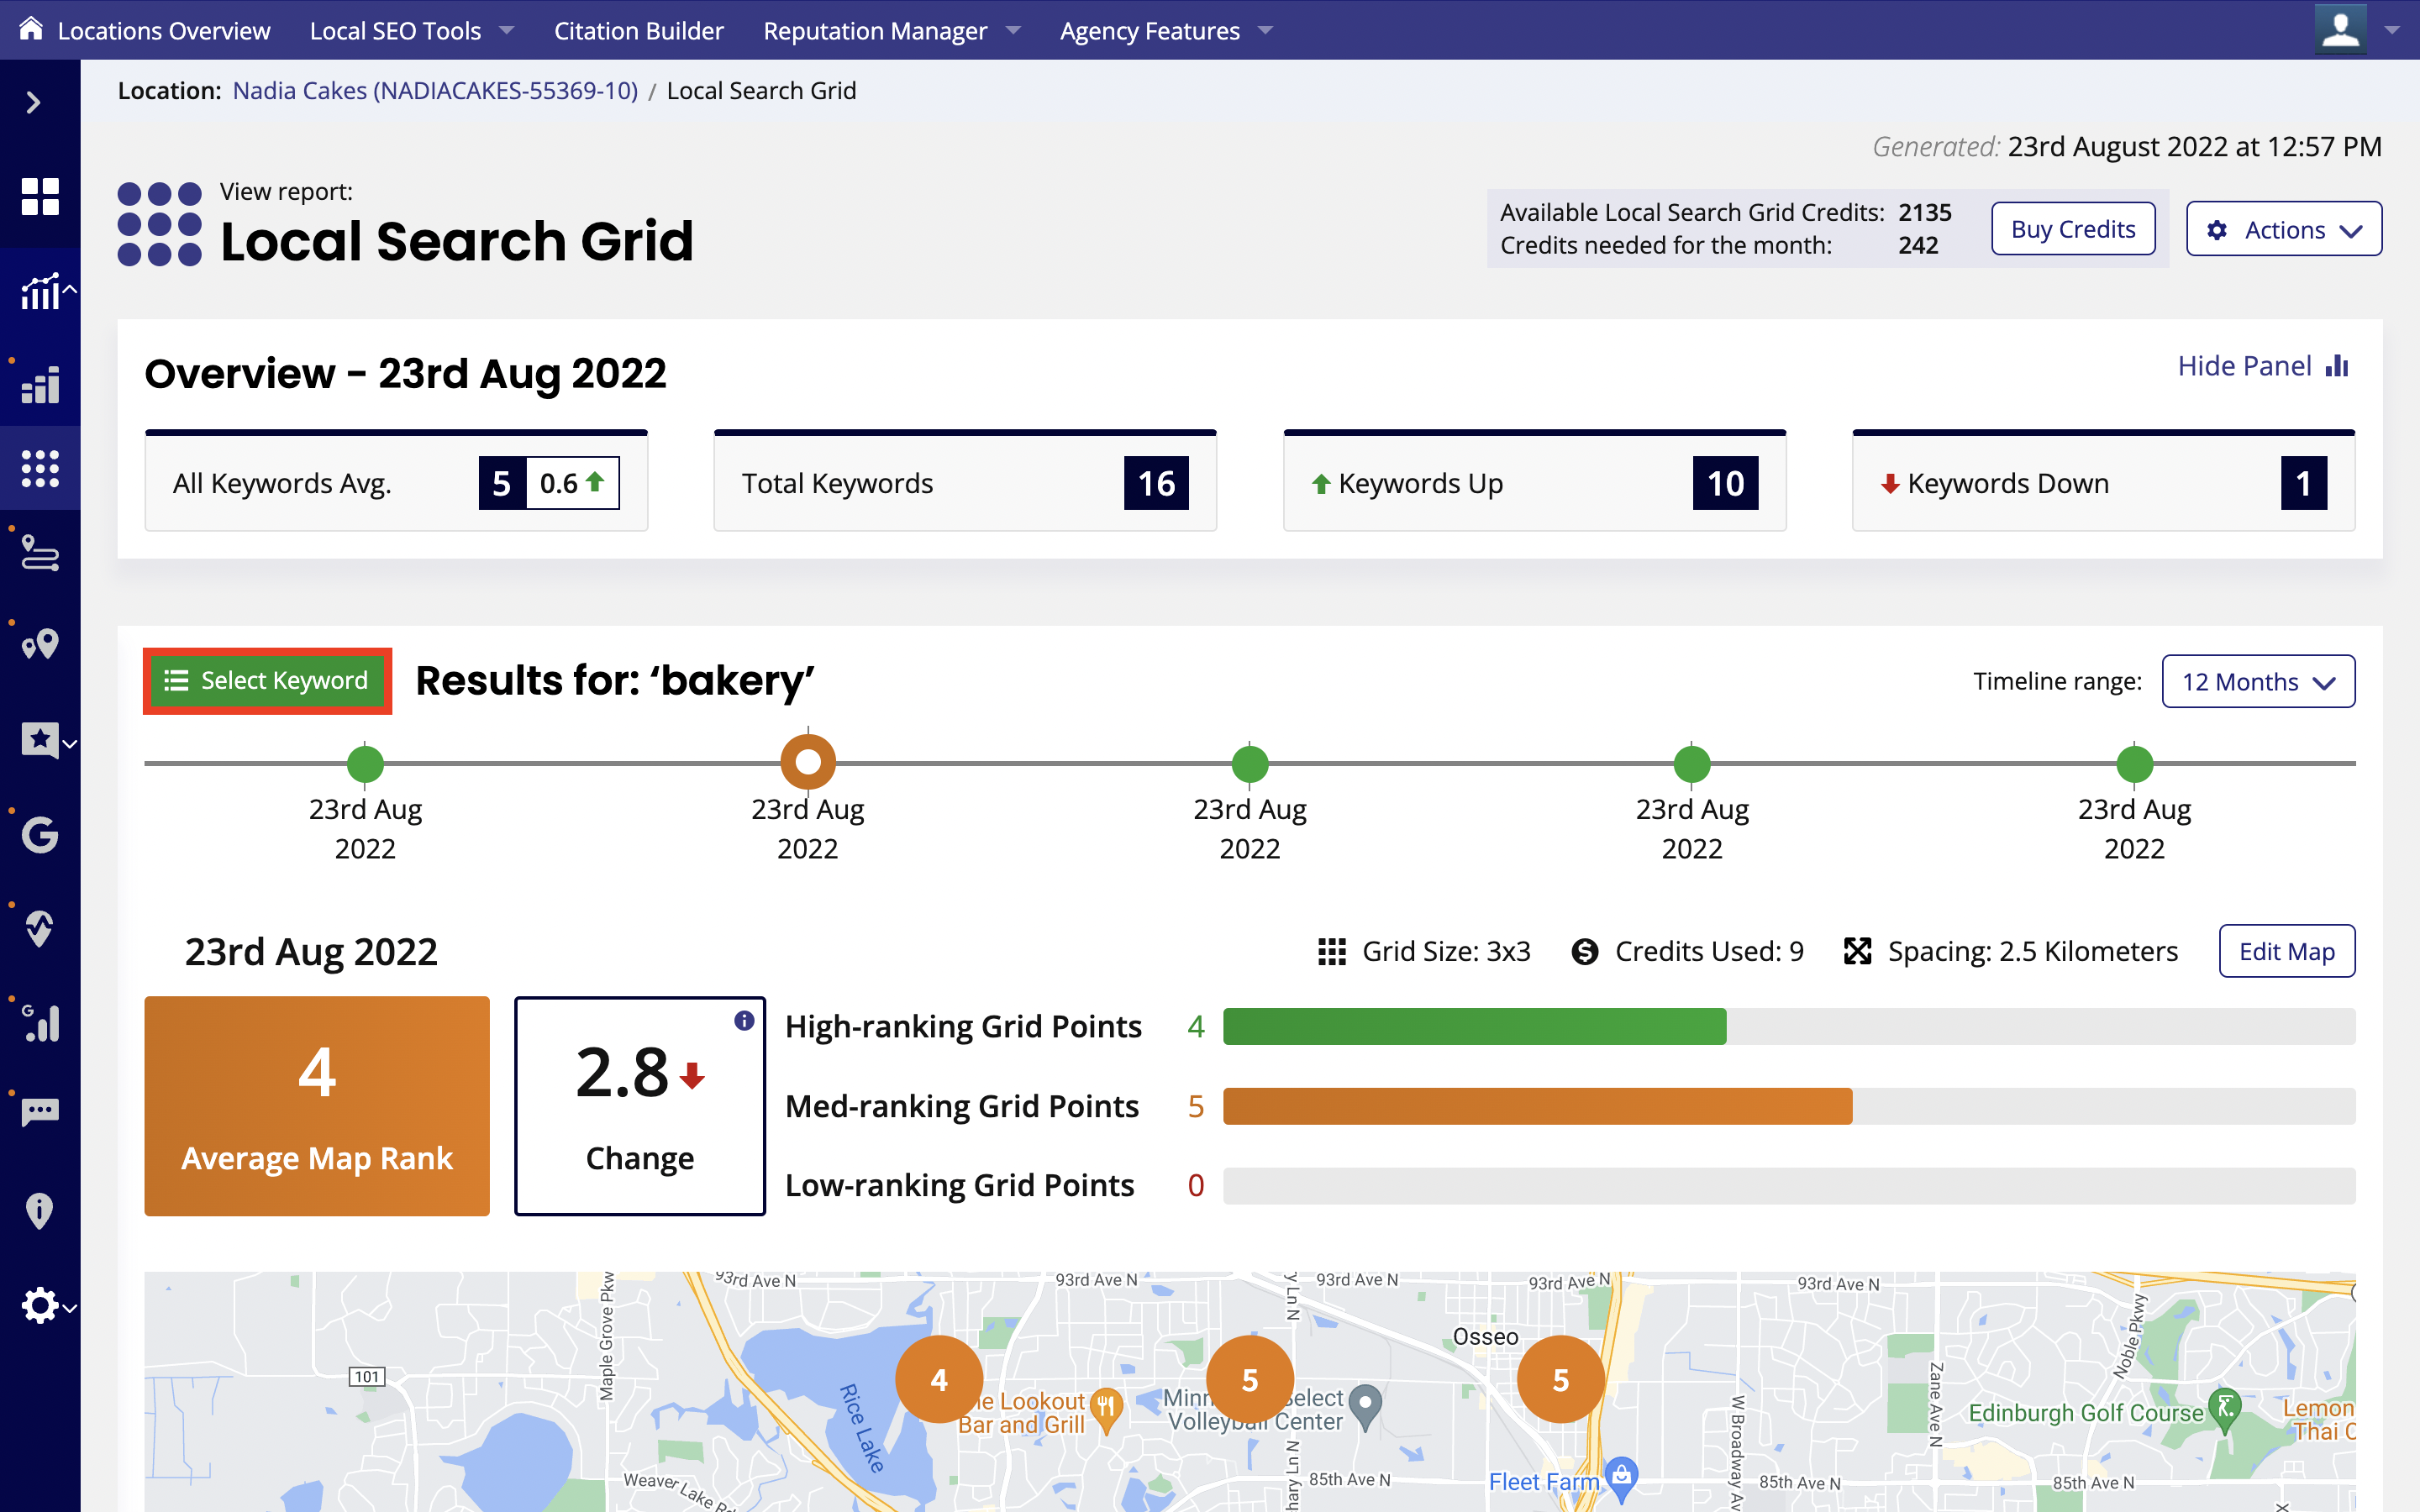
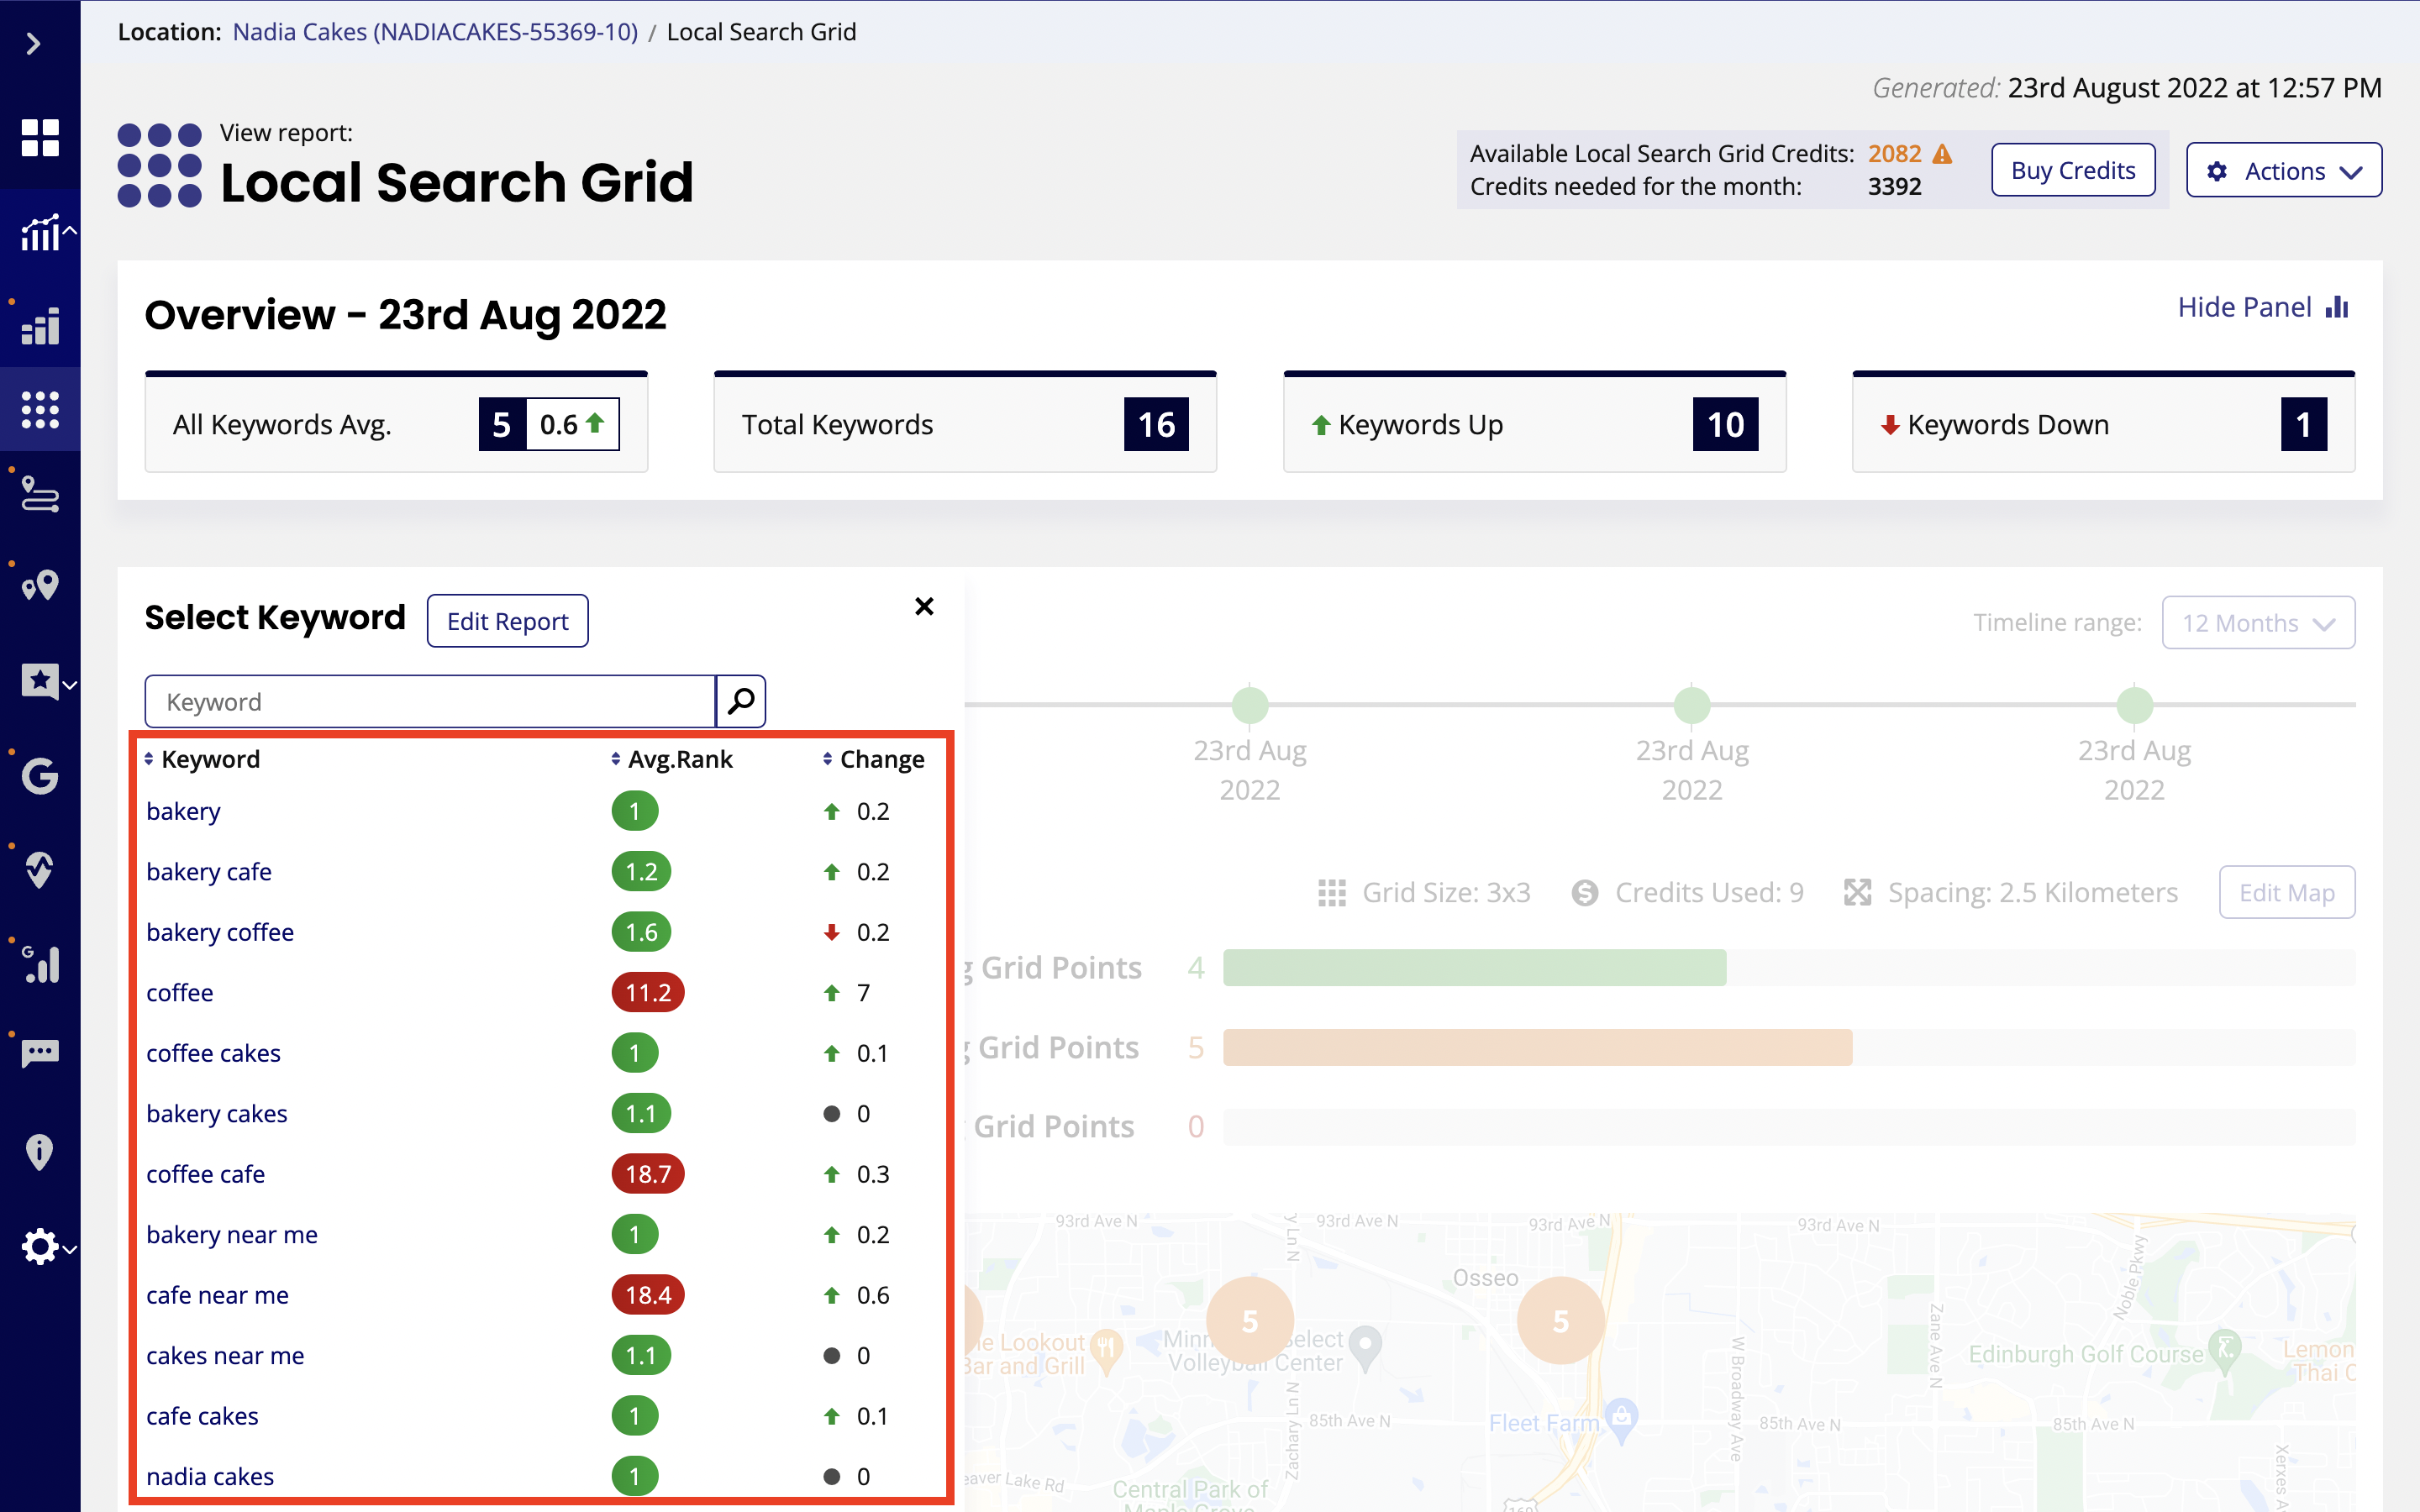
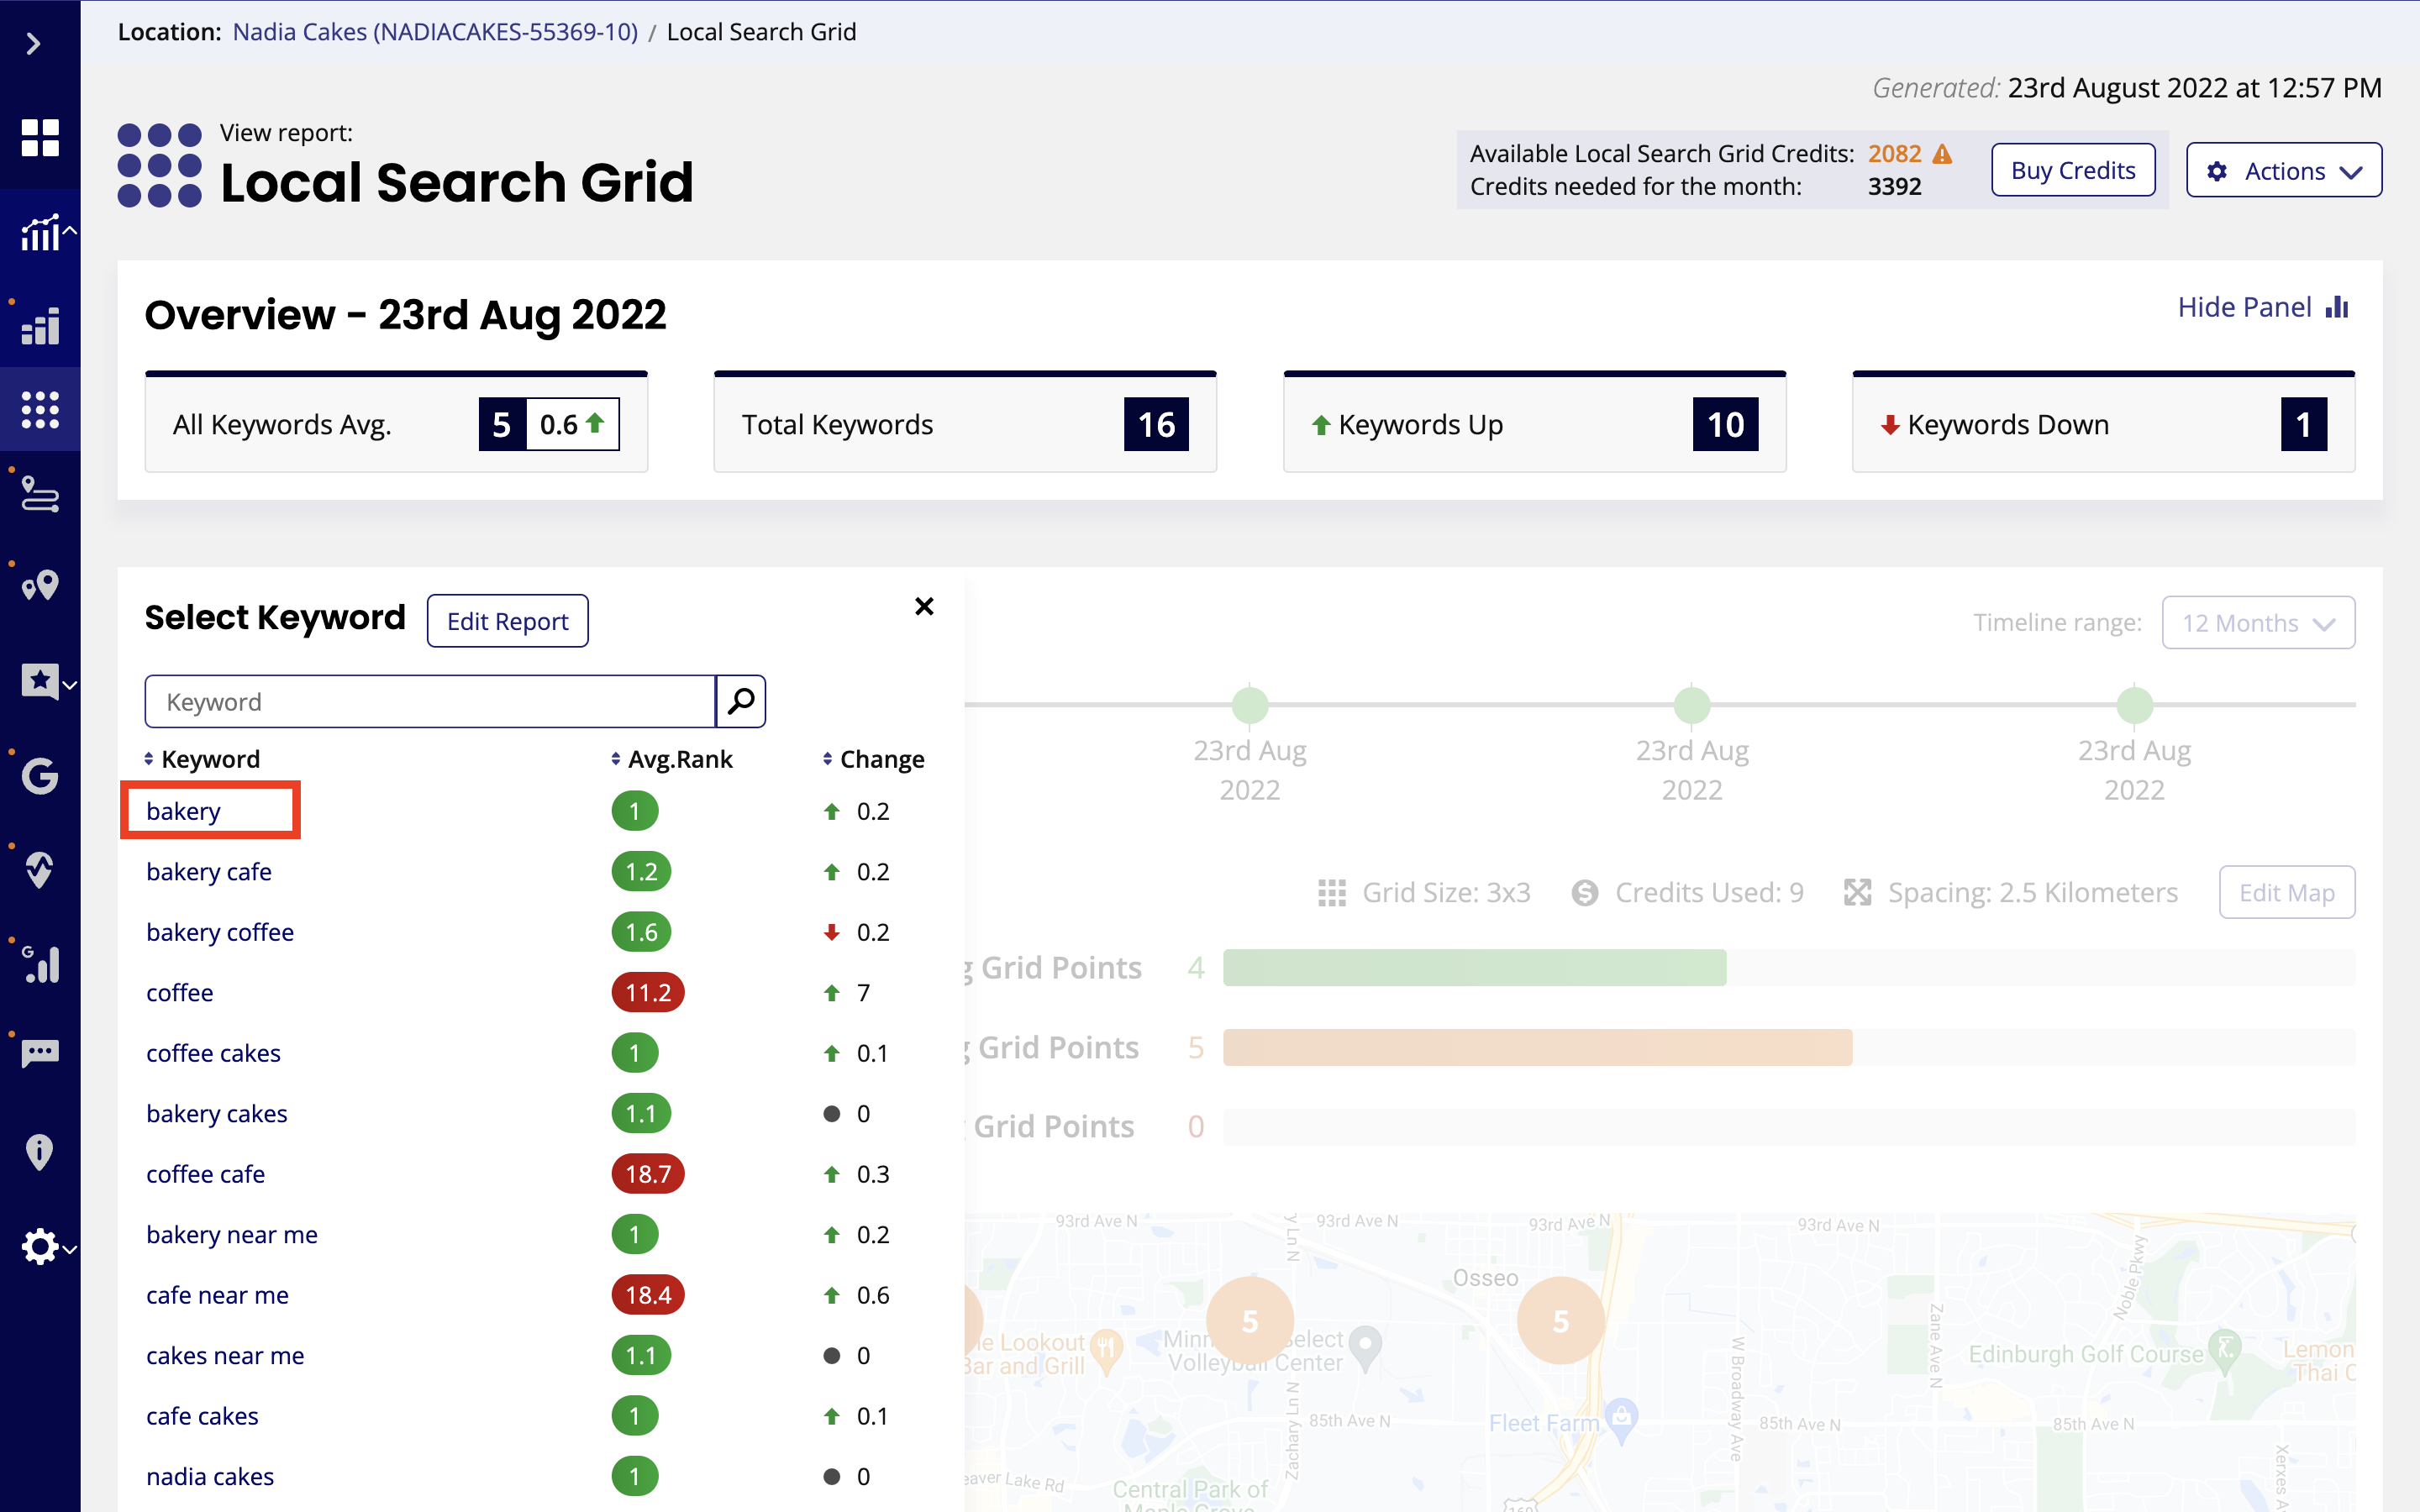
You can also click on each individual keyword to dig a little deeper.
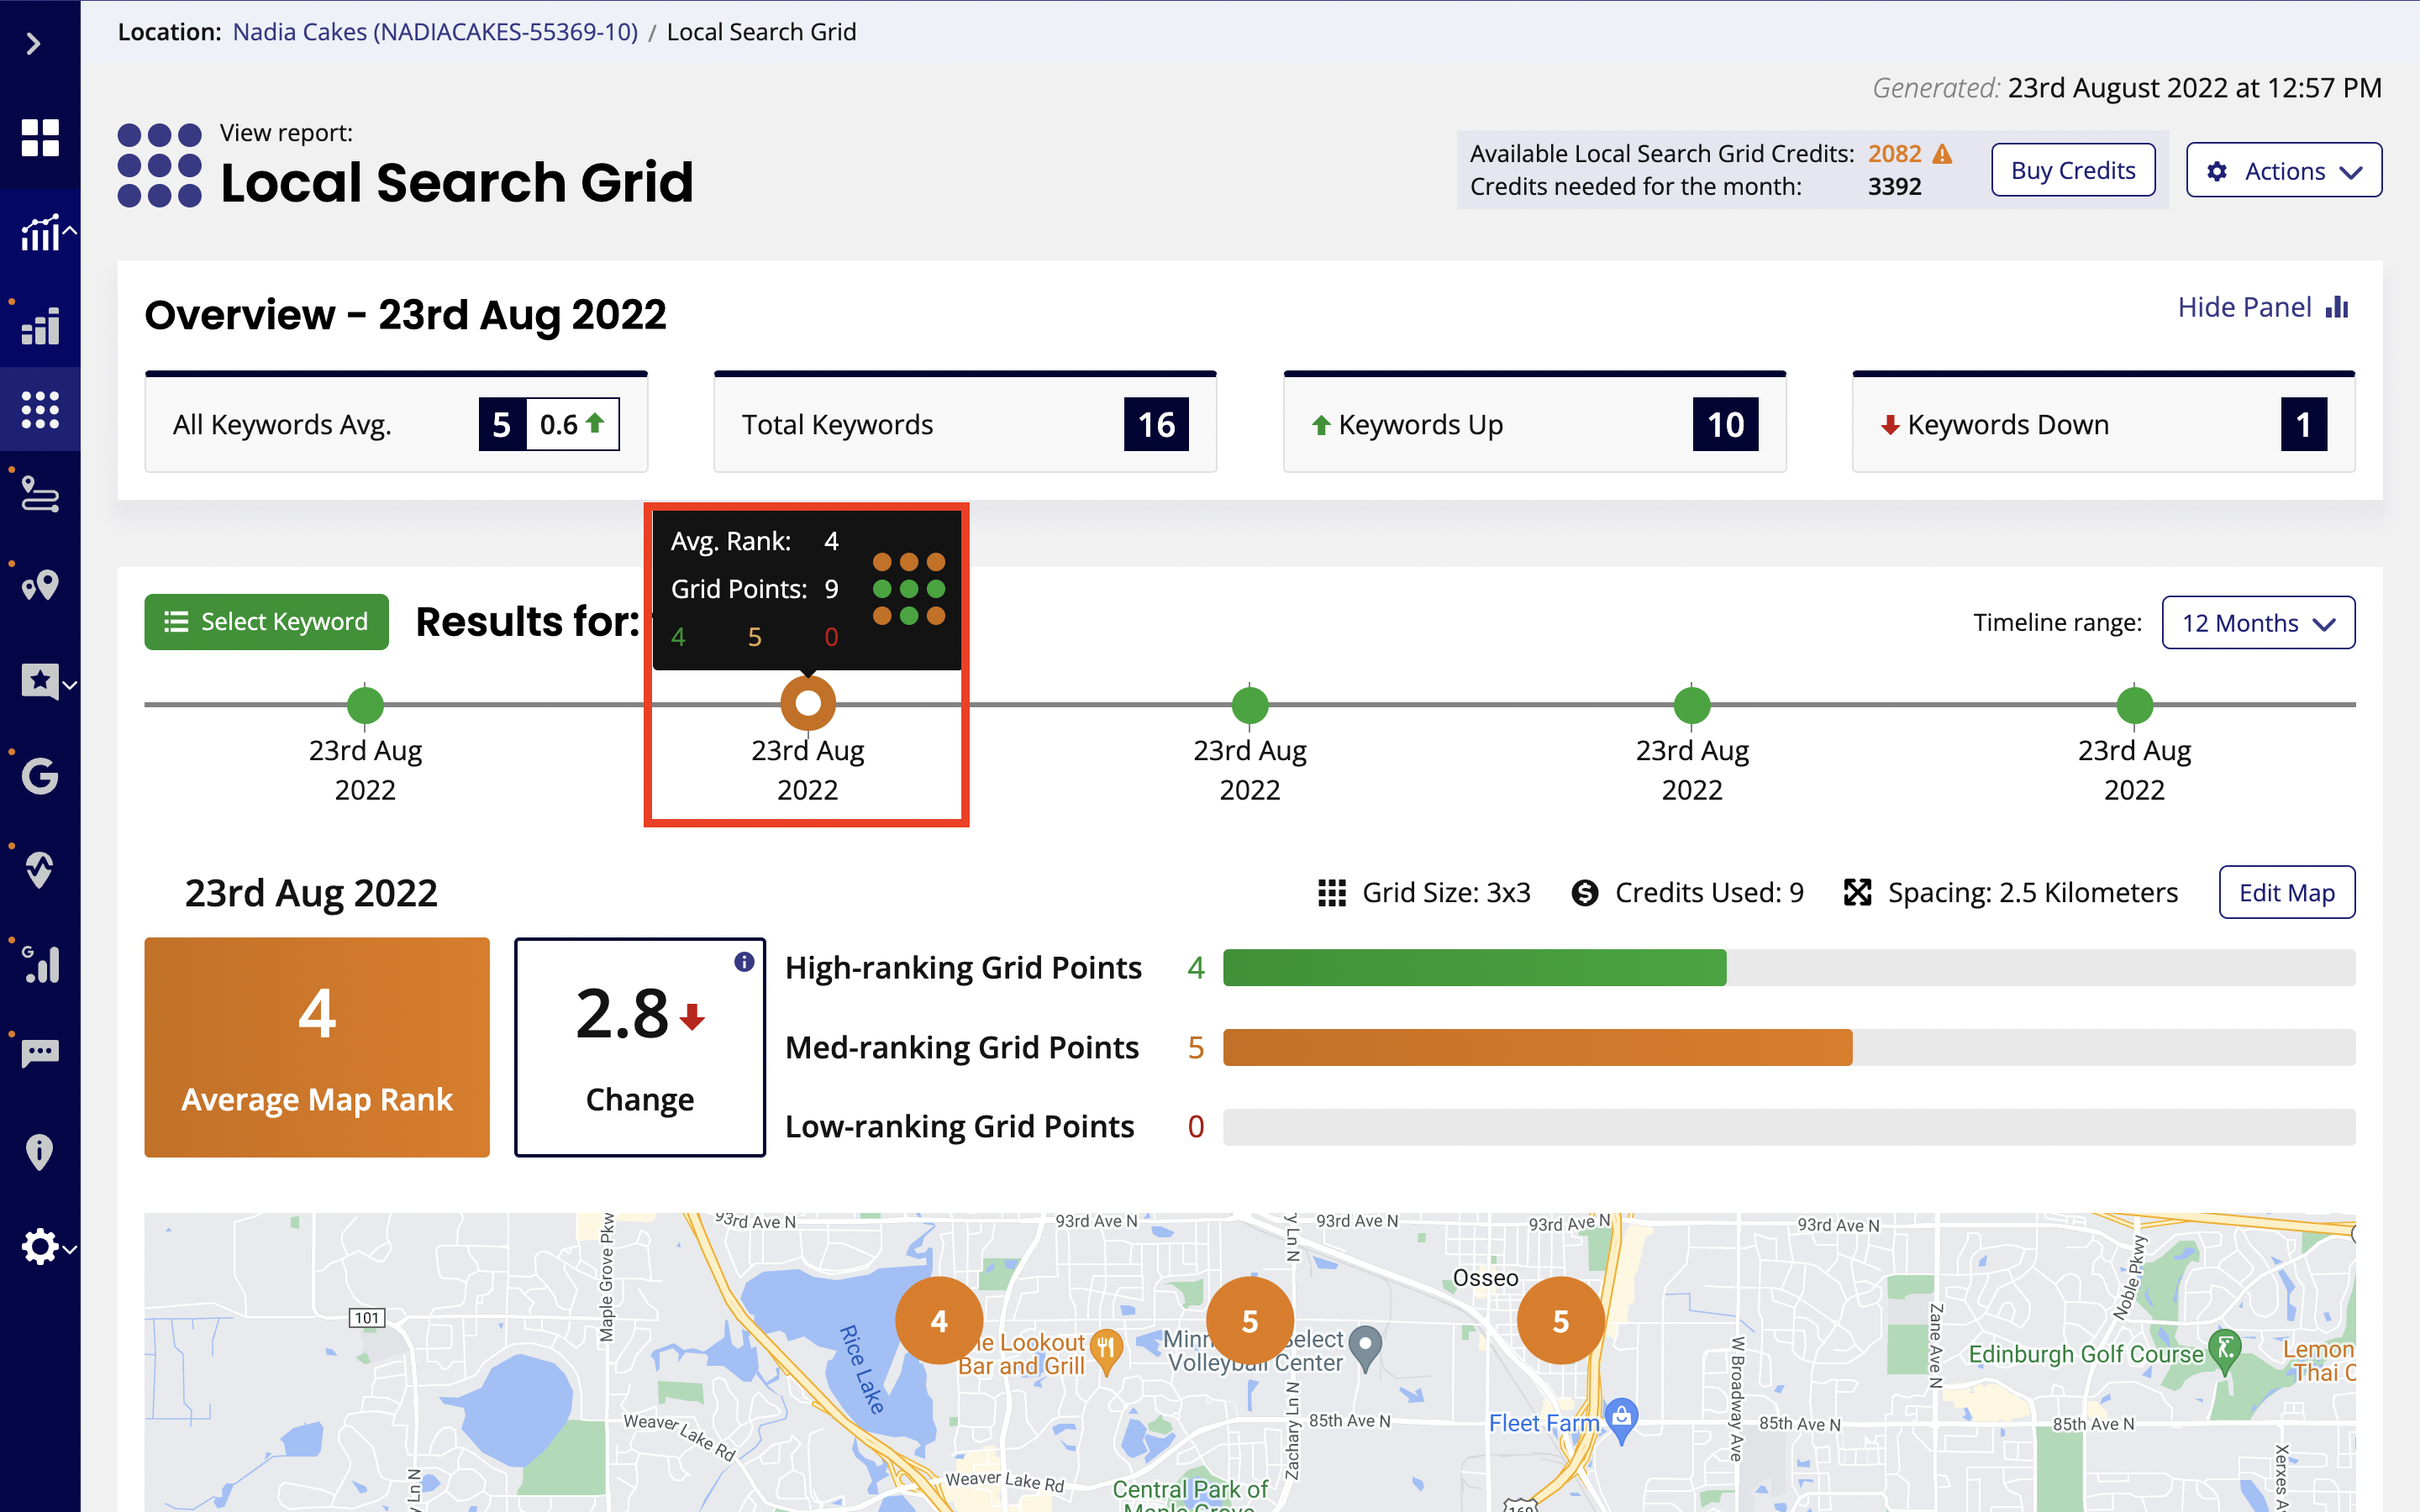
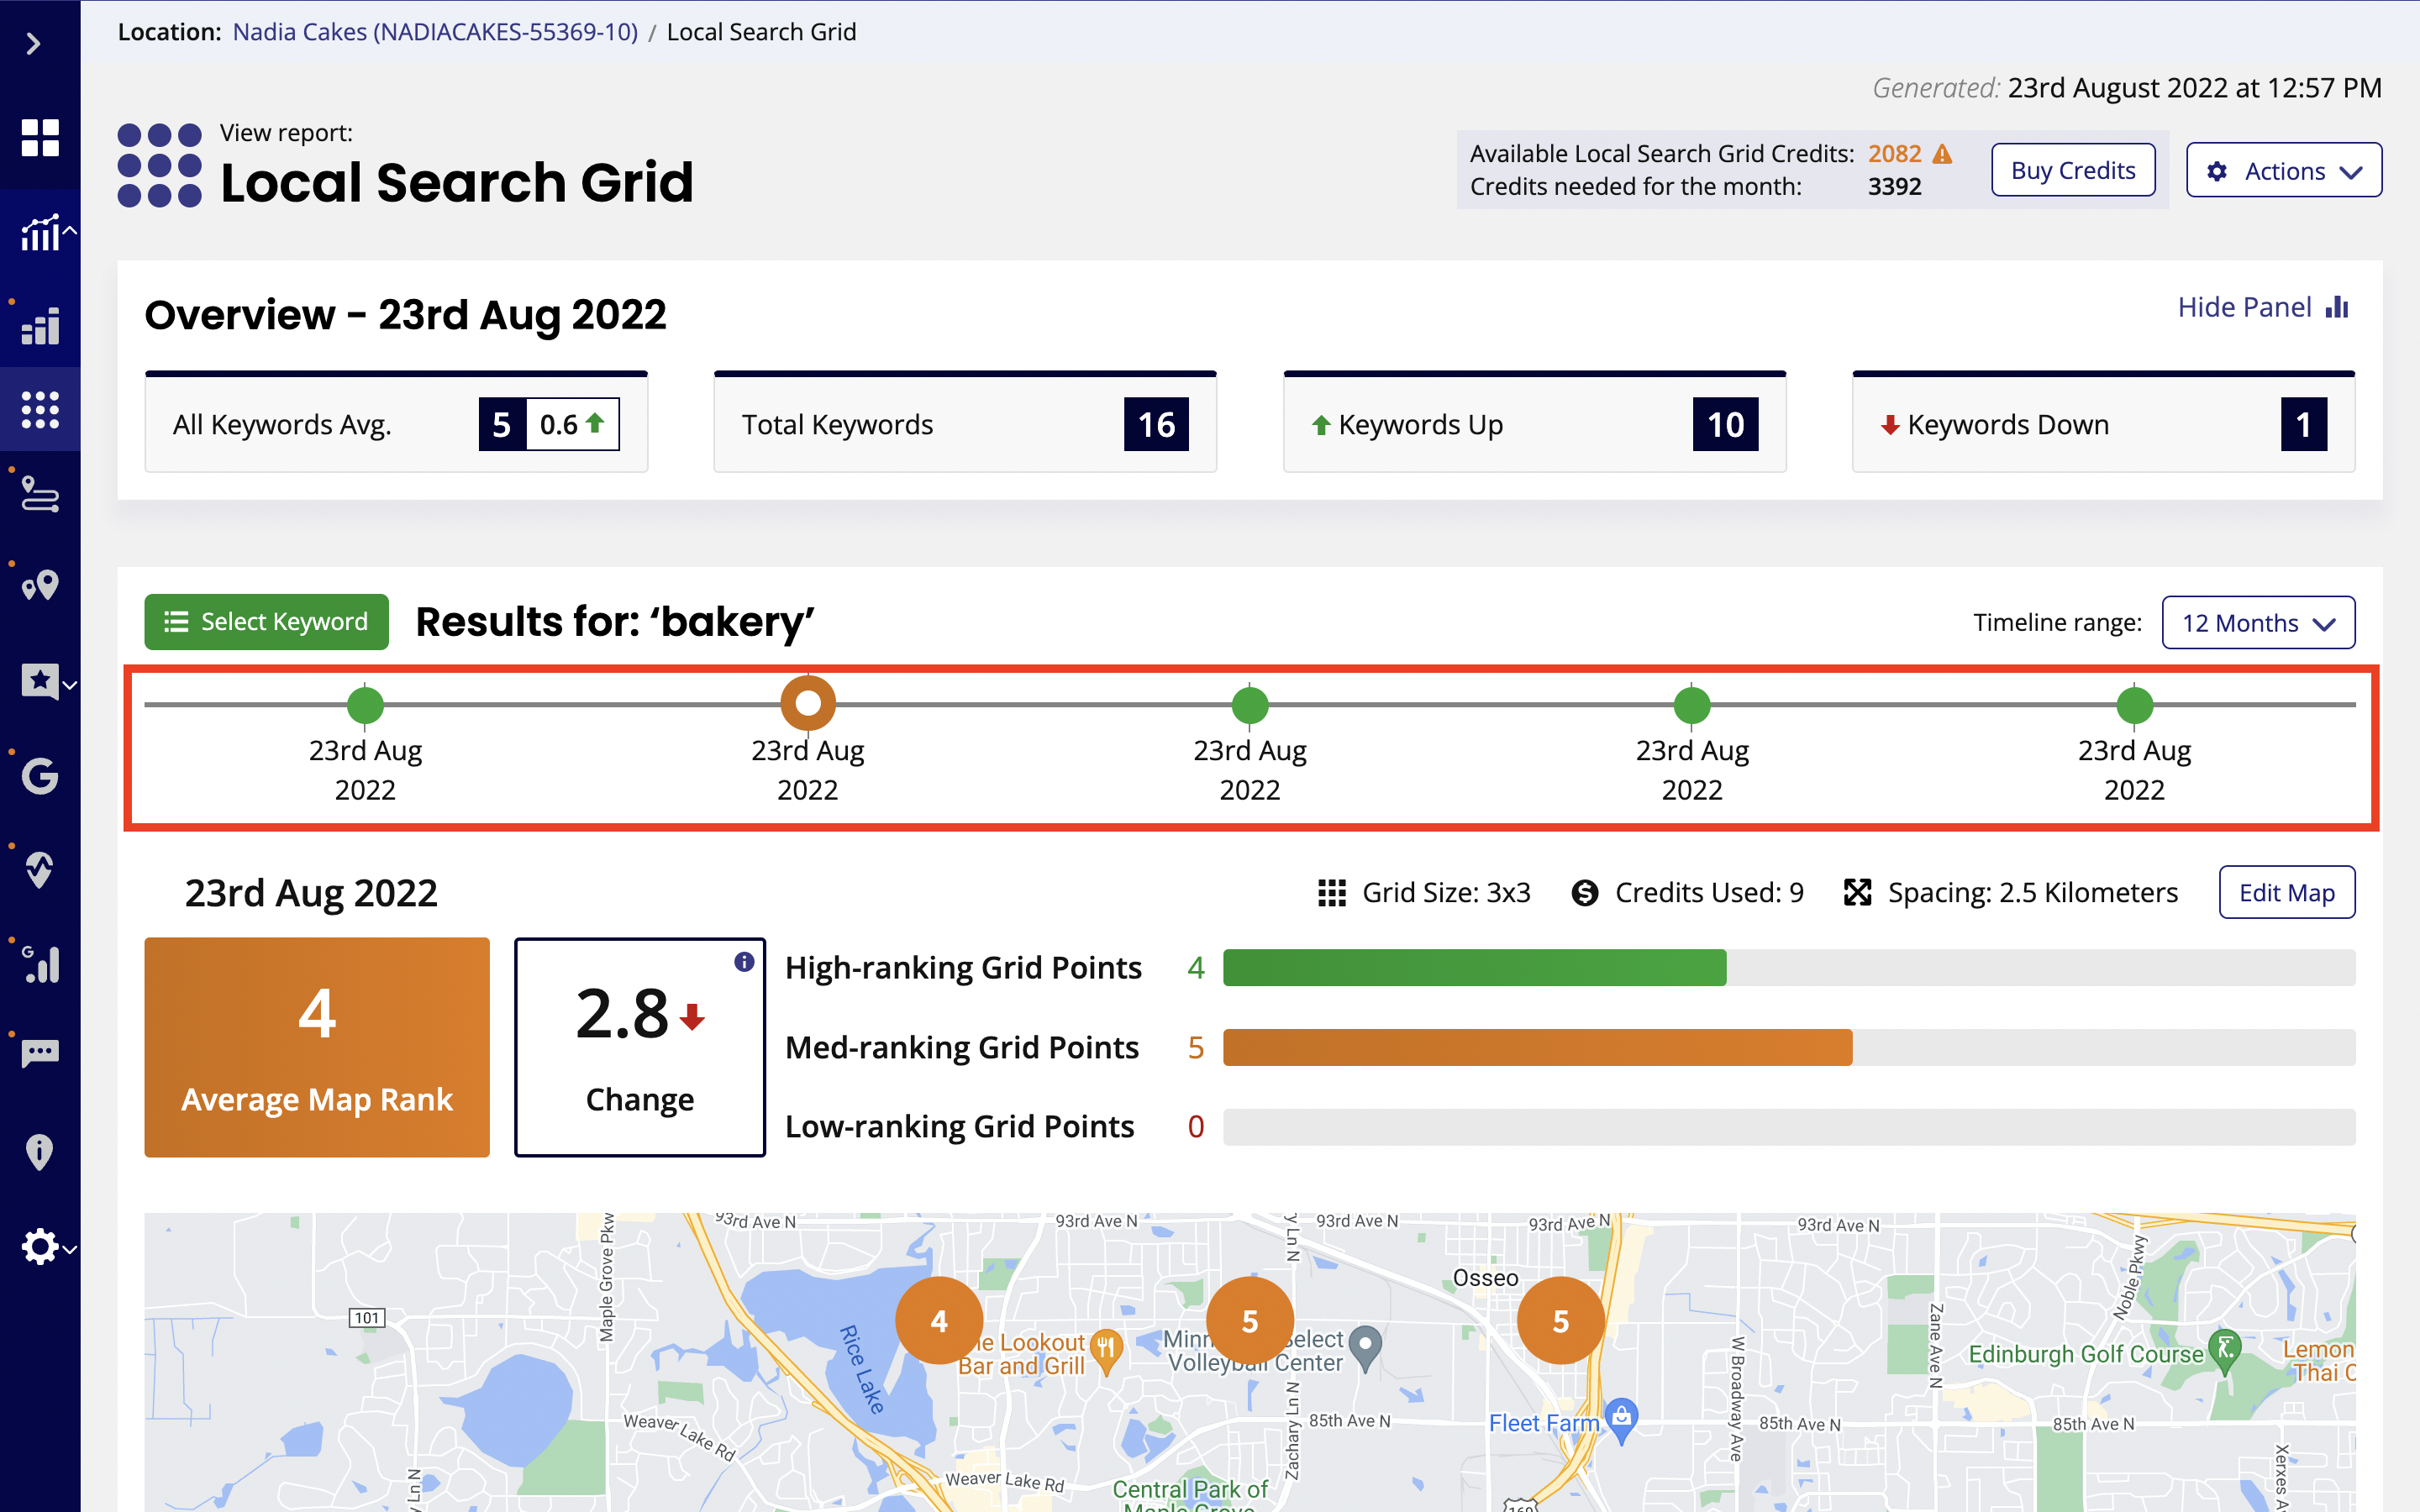
For each keyword, we can see a timeline. Each time the report is run another data point is added creating a visual representation of performance over time.

This is useful if you work for an agency and want to show your clients how your efforts are paying off. The data points are clickable making it easy to jump between reports and color-coded according to the reports' Average Map Rank. Green for positions 1-3, orange for positions 4-10, and red for positions 10+.
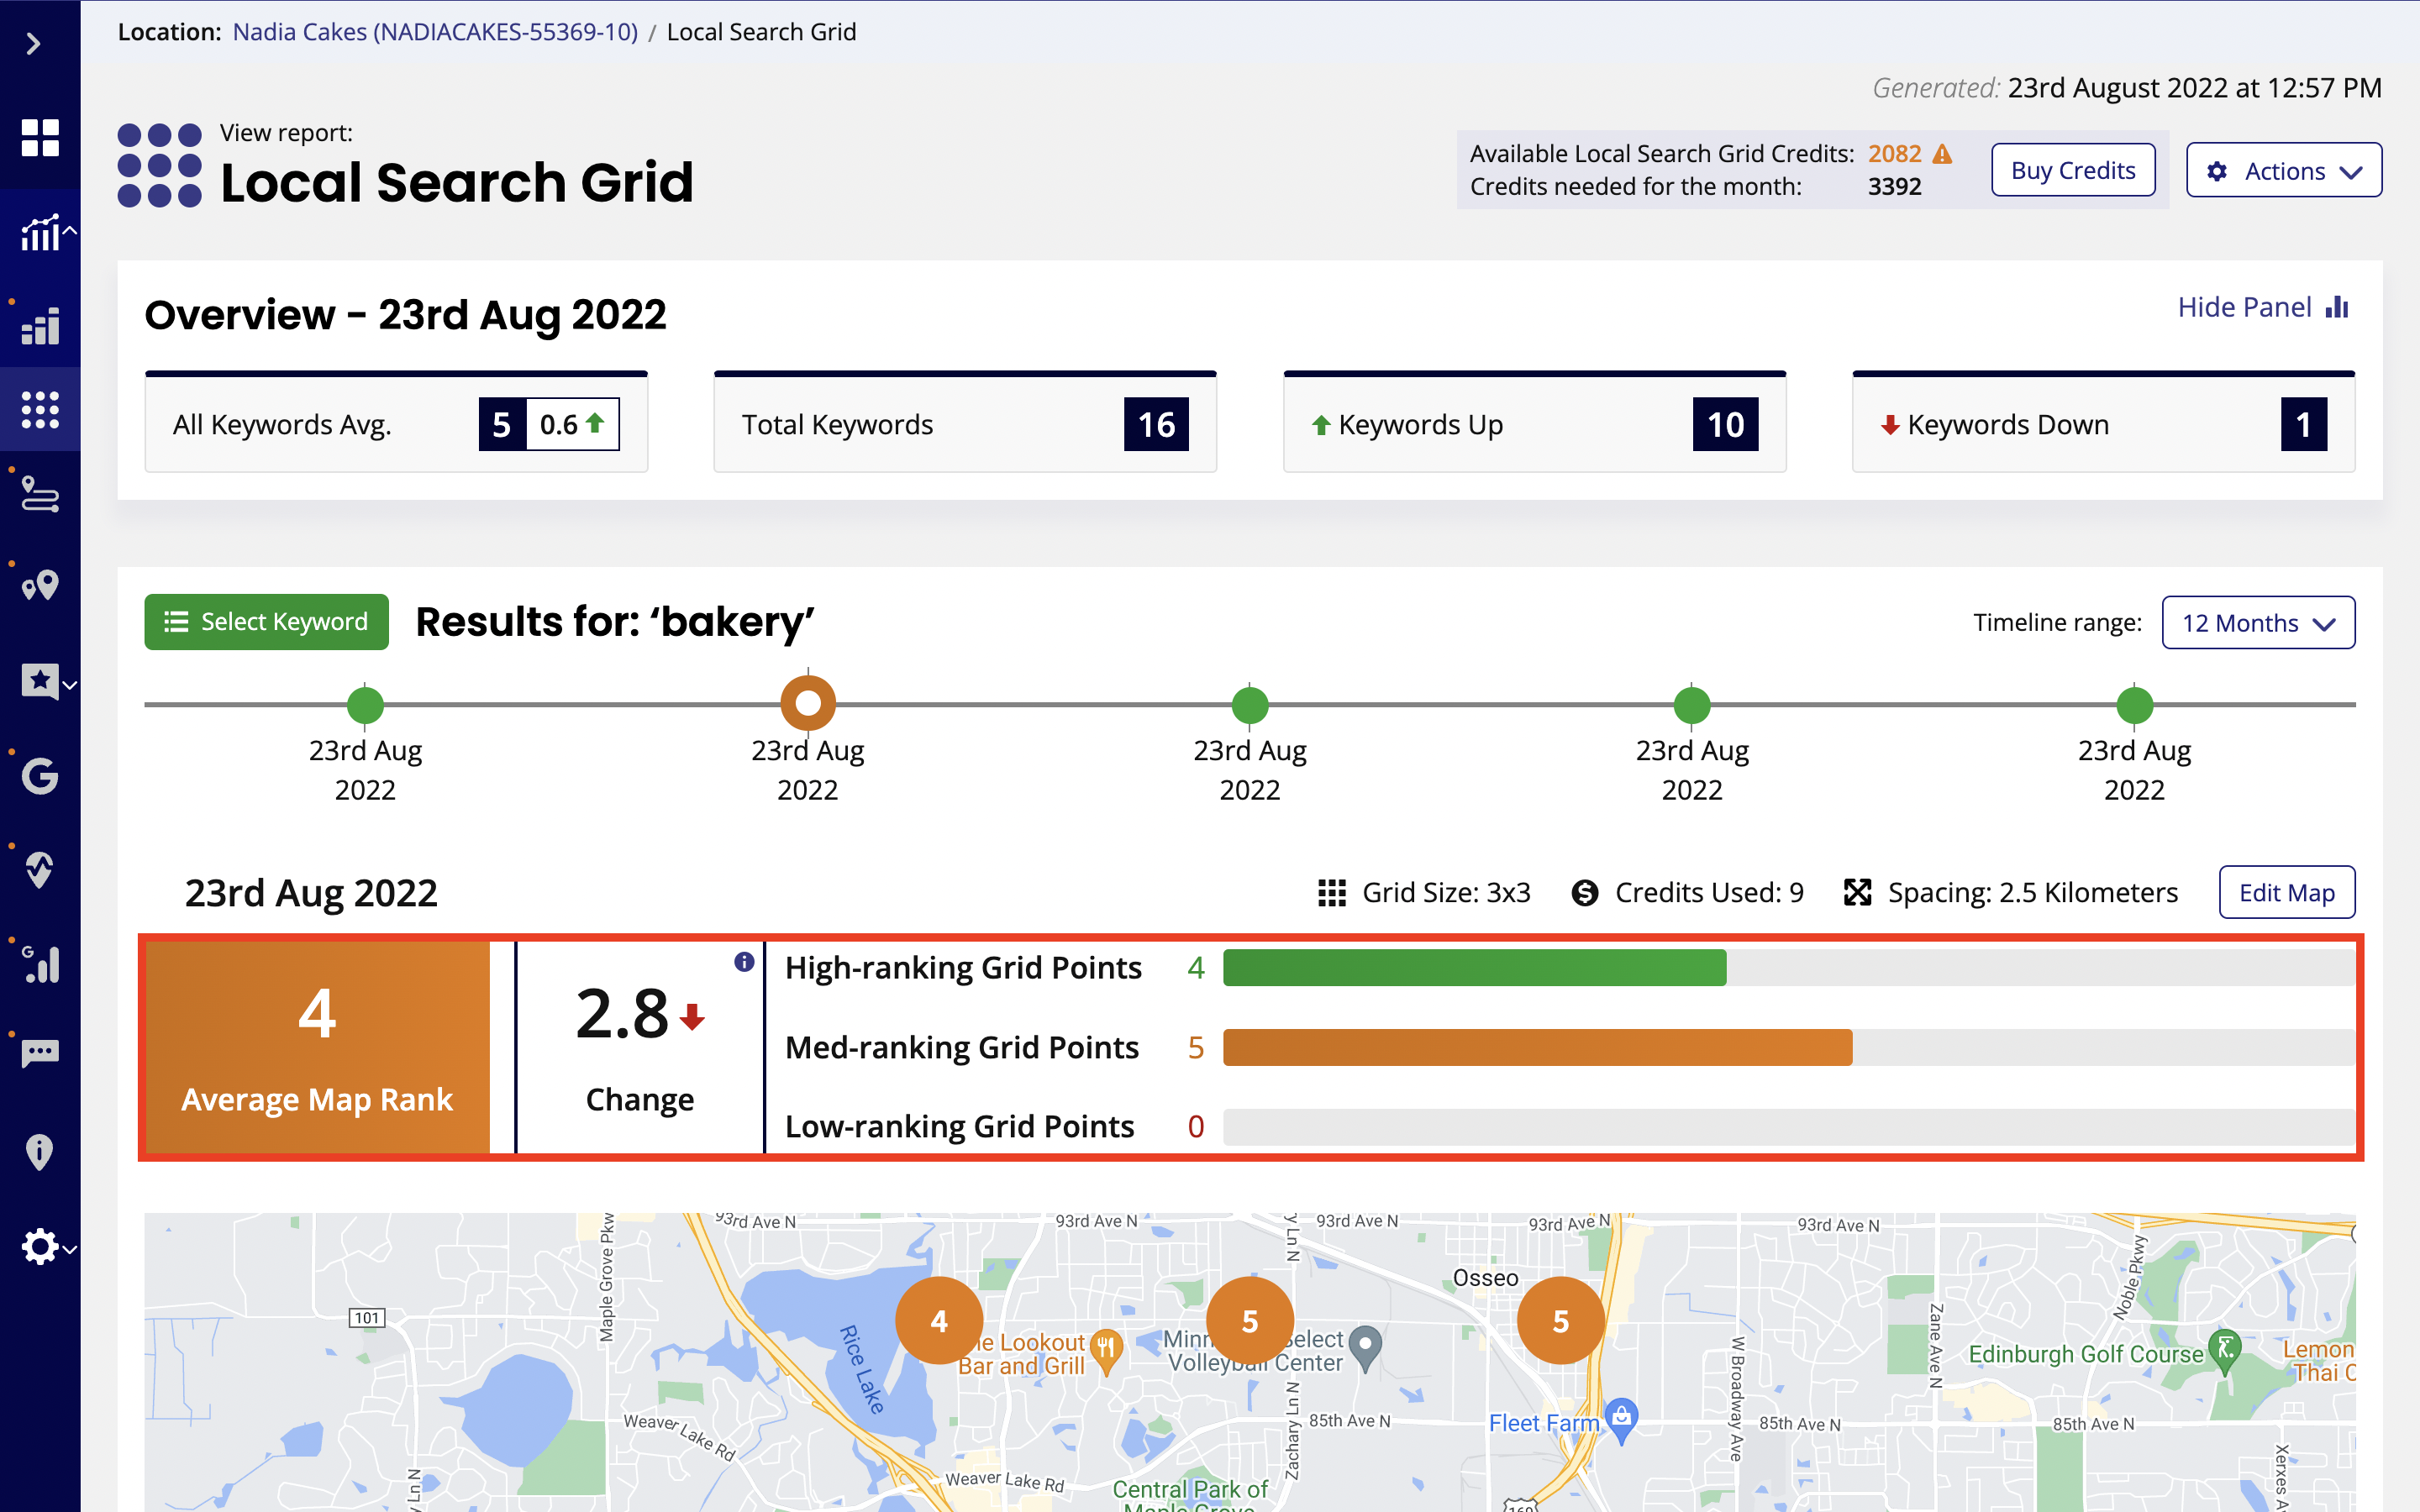
Below that is the Average Map Rank, this is calculated to show what the average ranking position is for a business. To find out this is calculated, click here.
You can also see the change in ranking for the keyword since the previous report run, as well as the number of high, medium, and low ranking grid points.
The map below shows you where you’re ranking at different places on the map. Green for positions 1-3, orange for positions 4-10 and red for positions 10+.
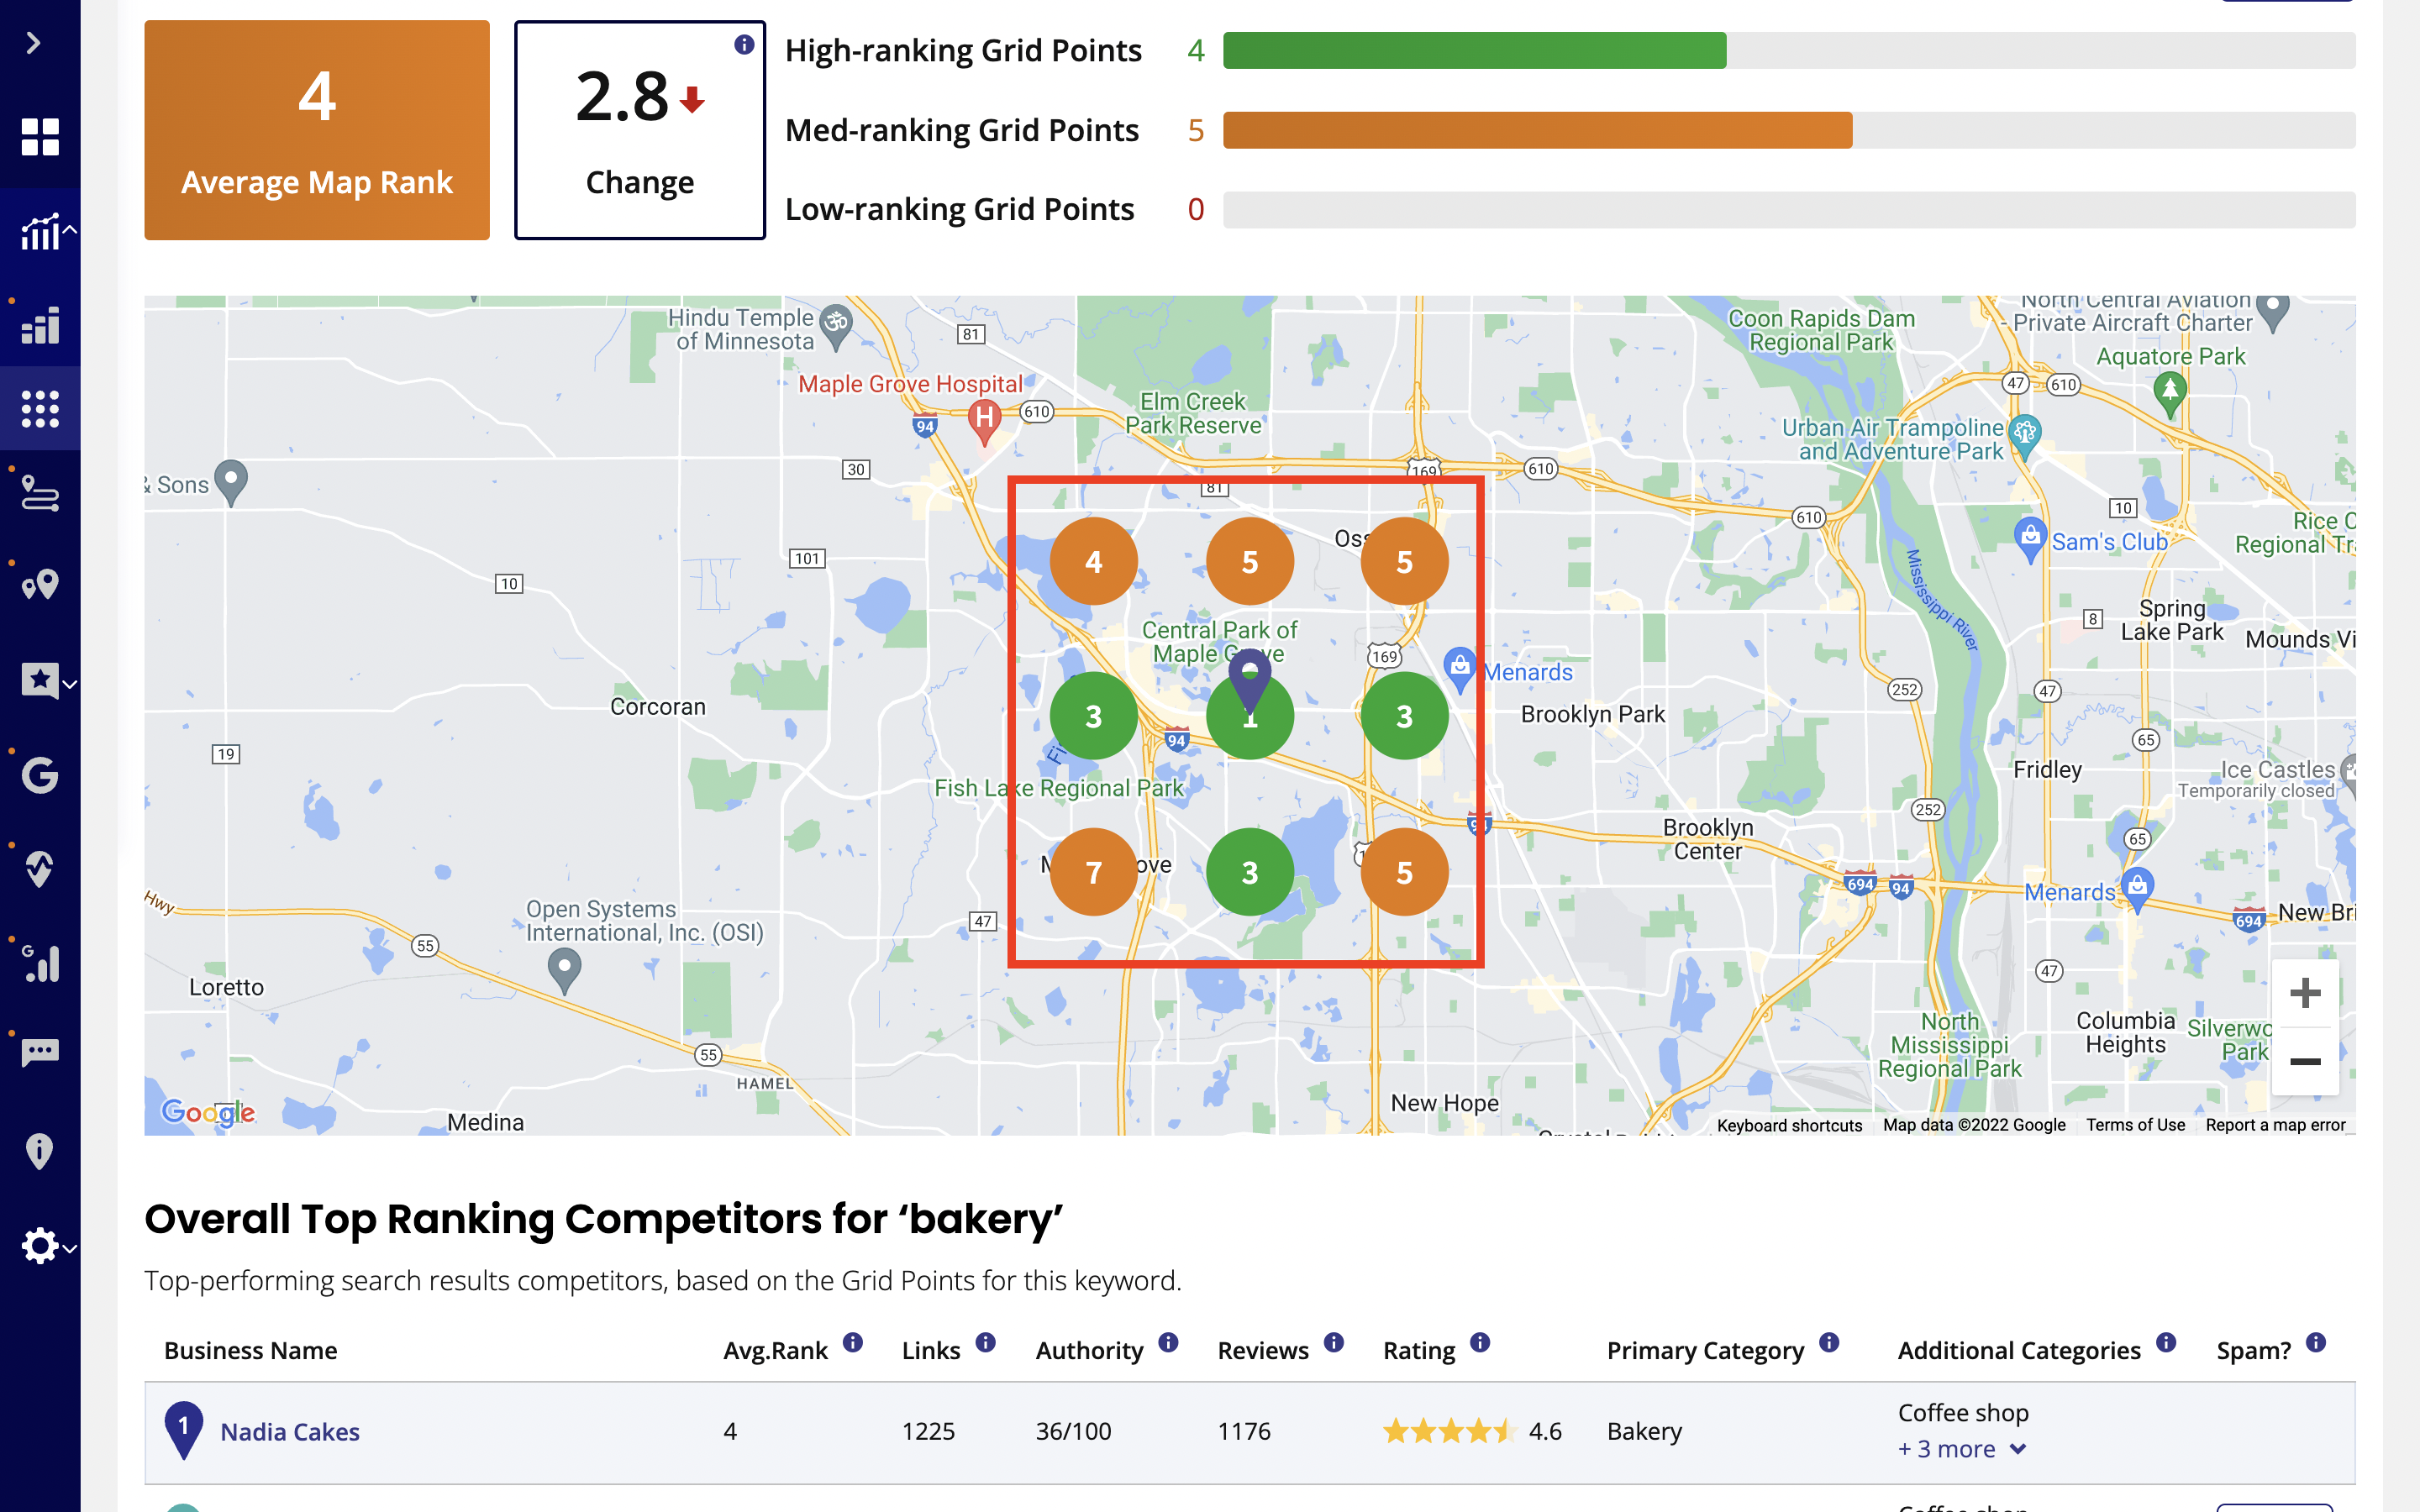
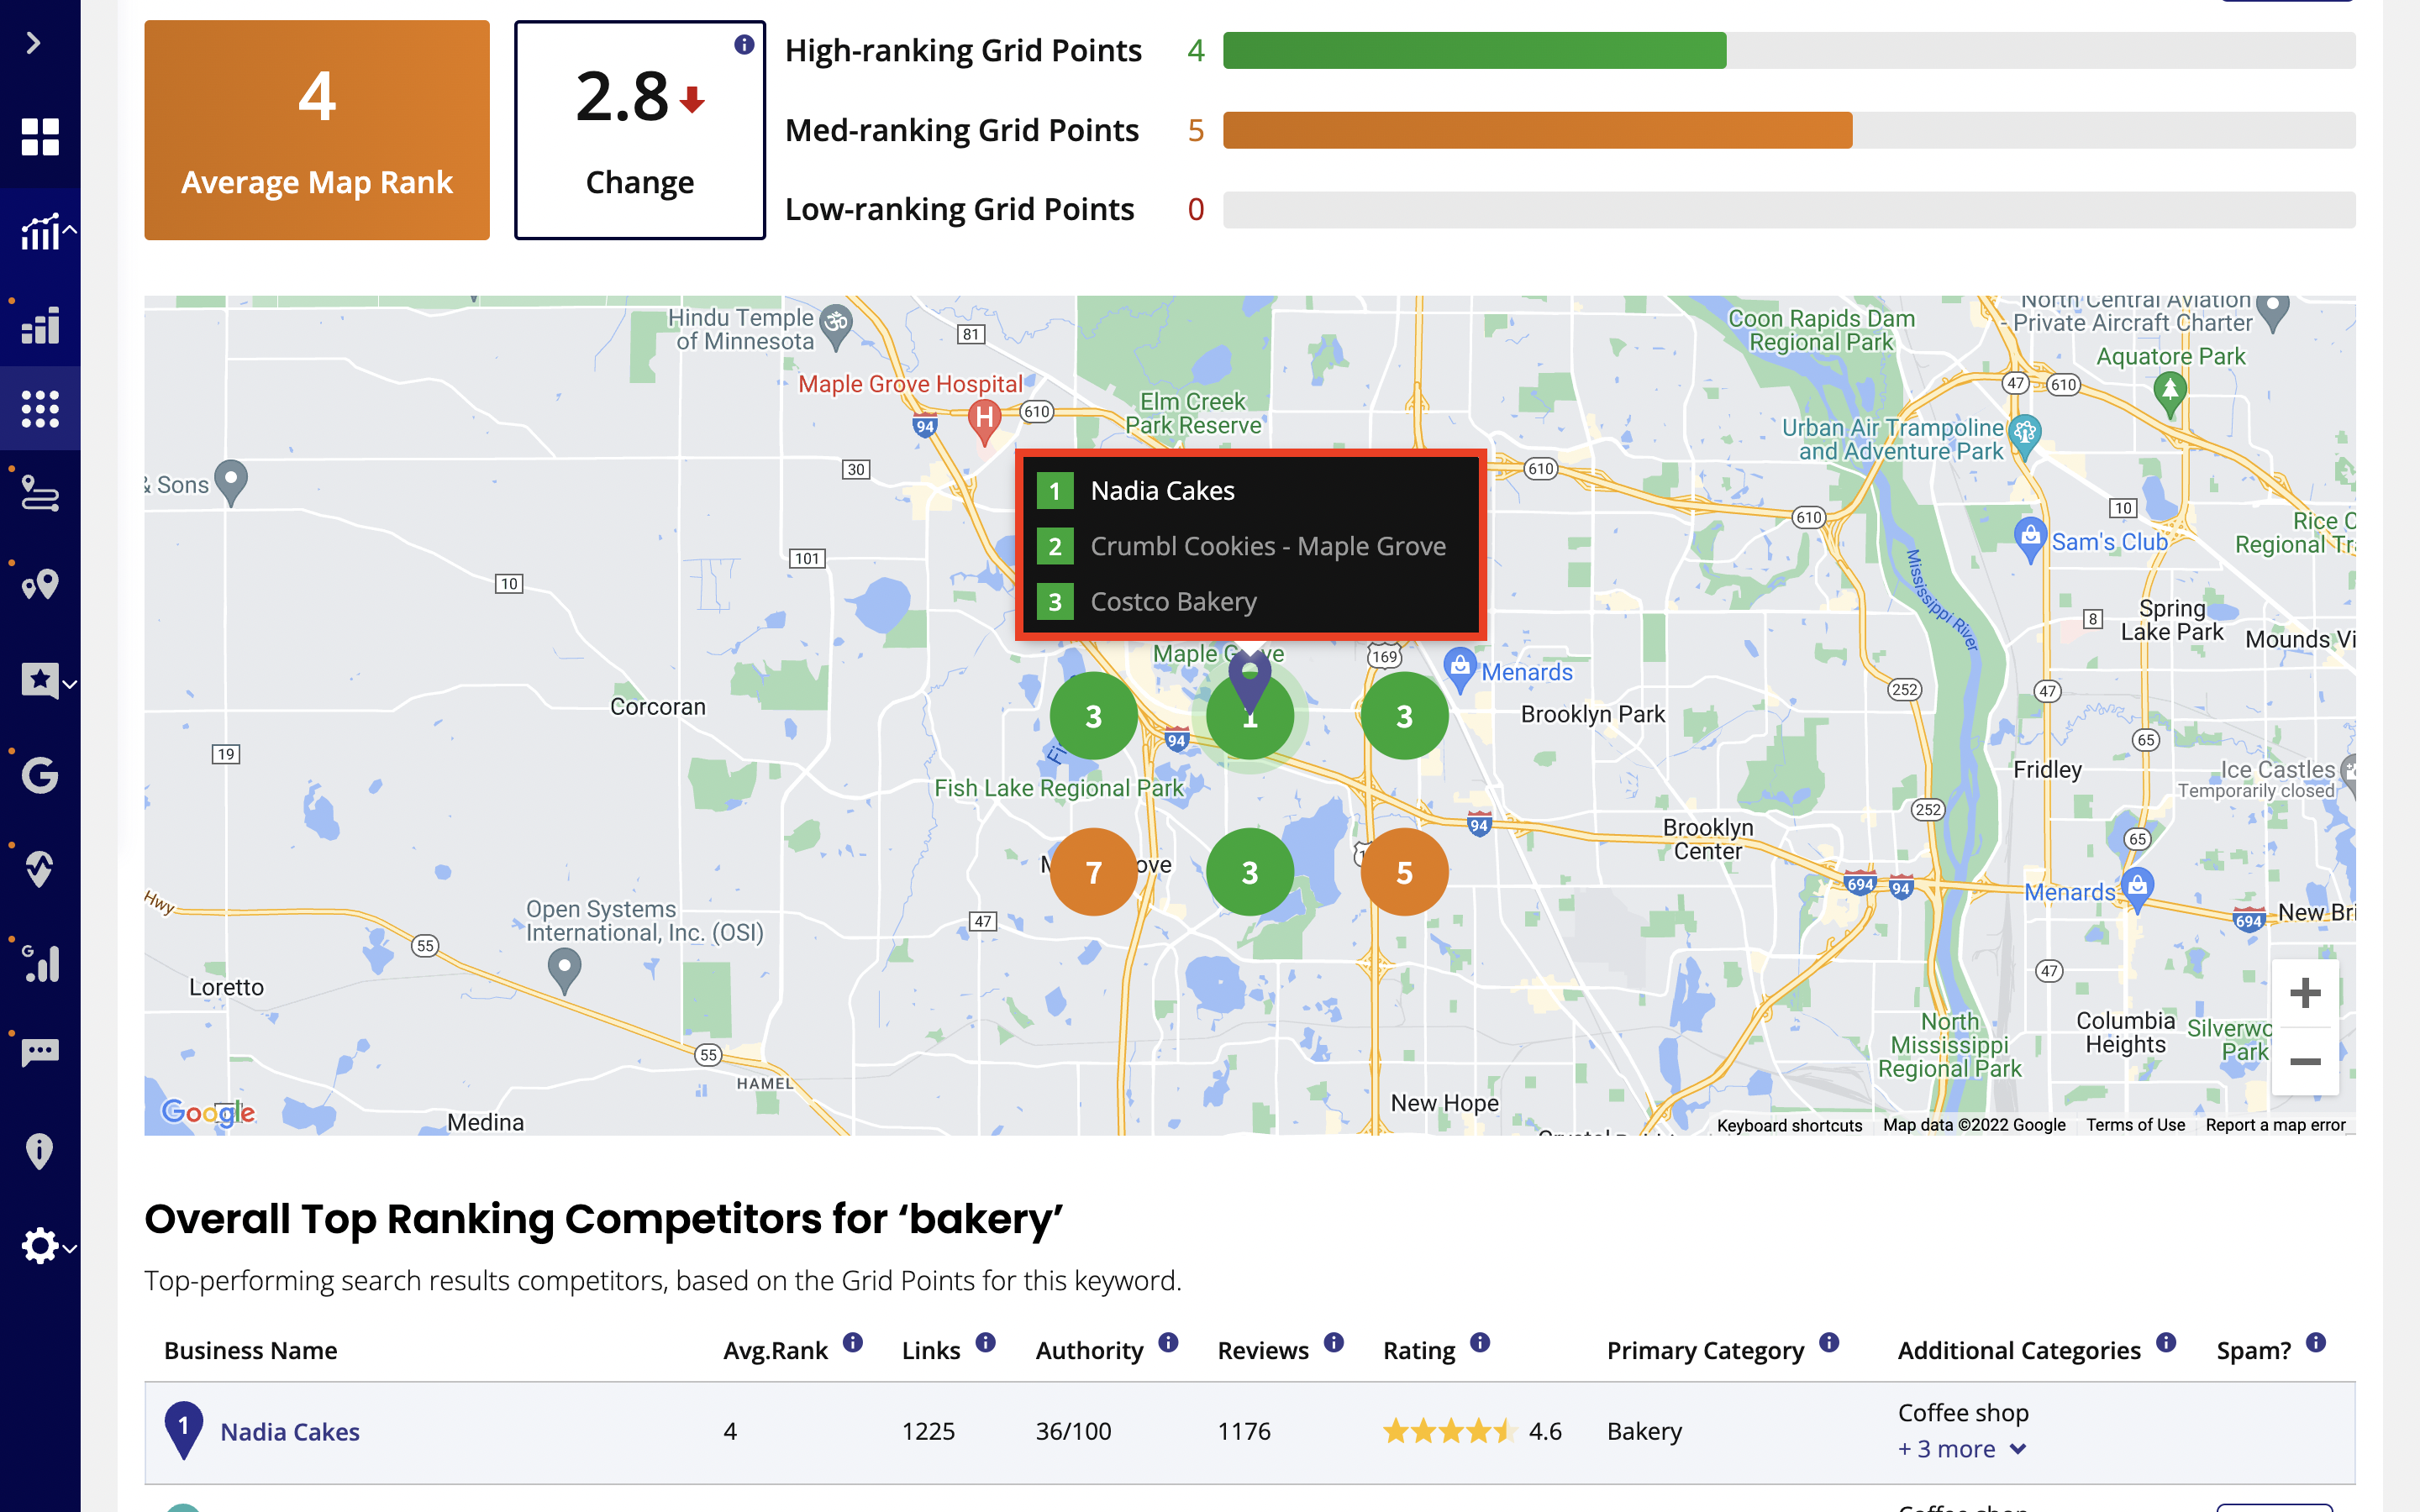
Hovering over the individual grid points reveals who the competitors are for each one.
If you see the letters NF here they stand for ‘Not Found’. This means that Google was unable to find your business in the top 20 results for this grid point.
If your business isn’t the top 20 results, but we have more than one page we will show it as 21+ plus. This is because we only look at the data pulled in on page 1 results, anything greater than 21+ is not a good score to get on Google Maps.
You can also click the grid points and pop-up will appear (see image below) giving you further details on your competitors, such as their proximity to your business and how many reviews they have.
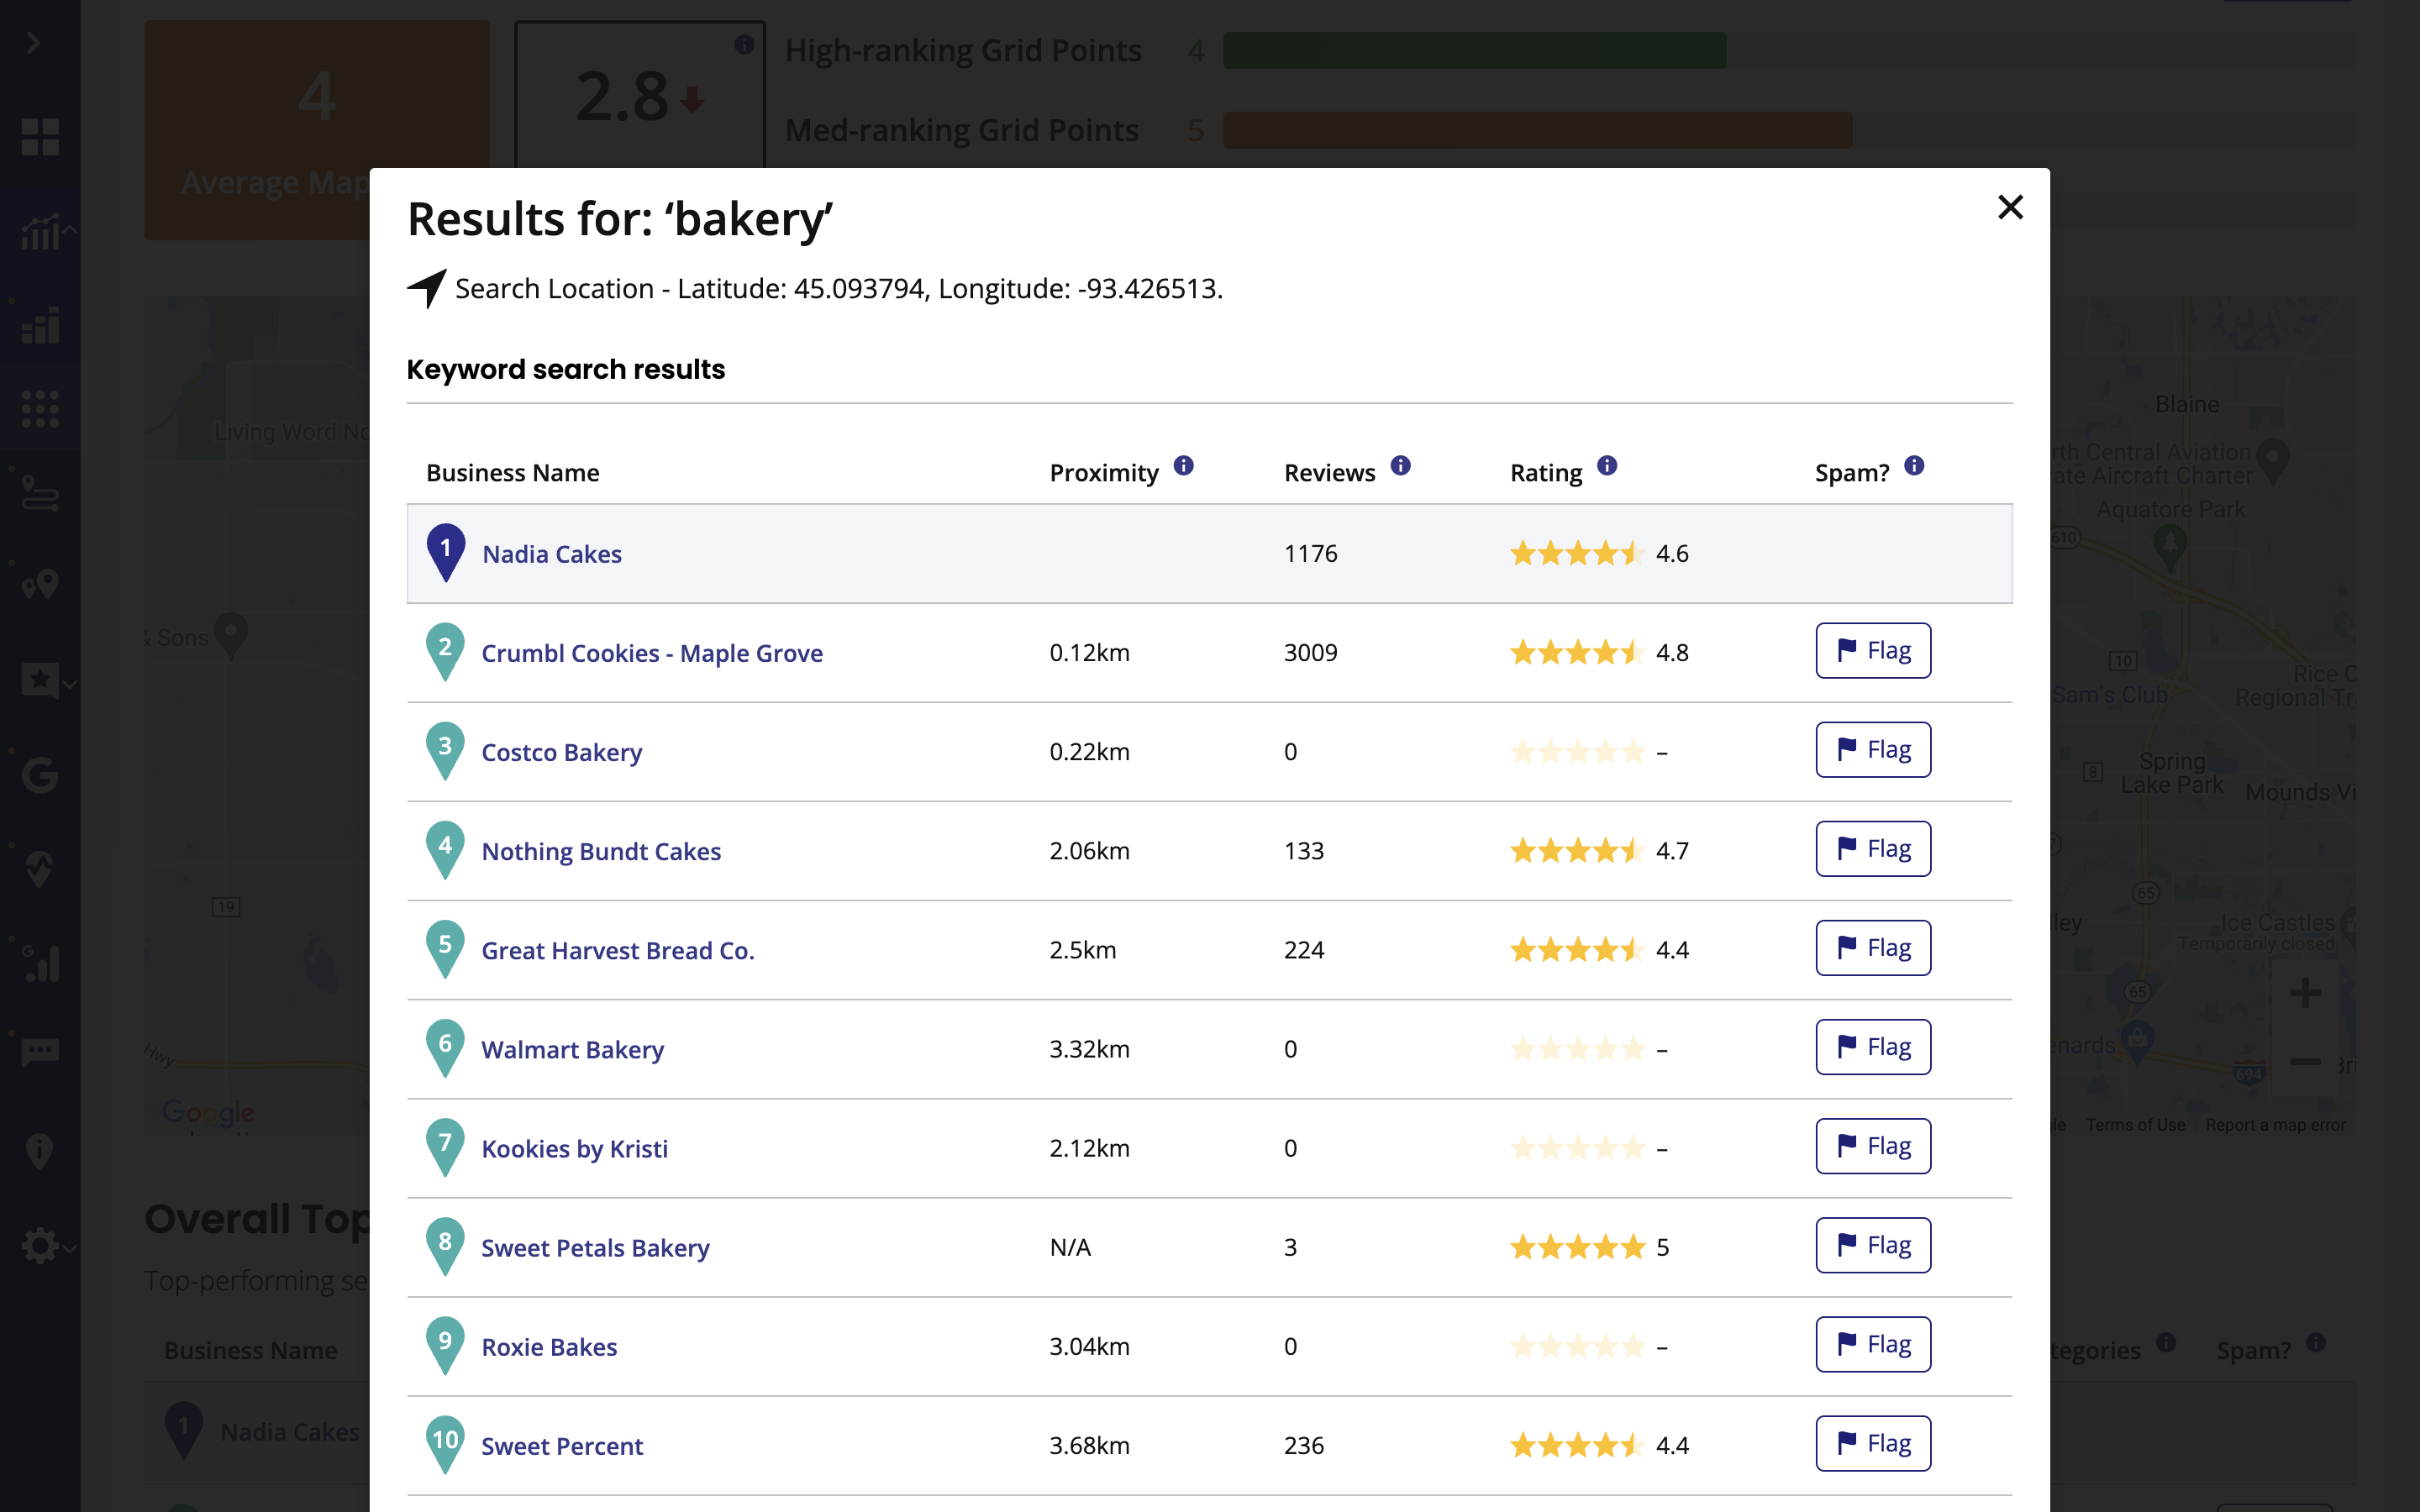
To see a screenshot of the search results, click the 'SERP Screenshot' button and a new tab will open showing you the search results in Google Maps.
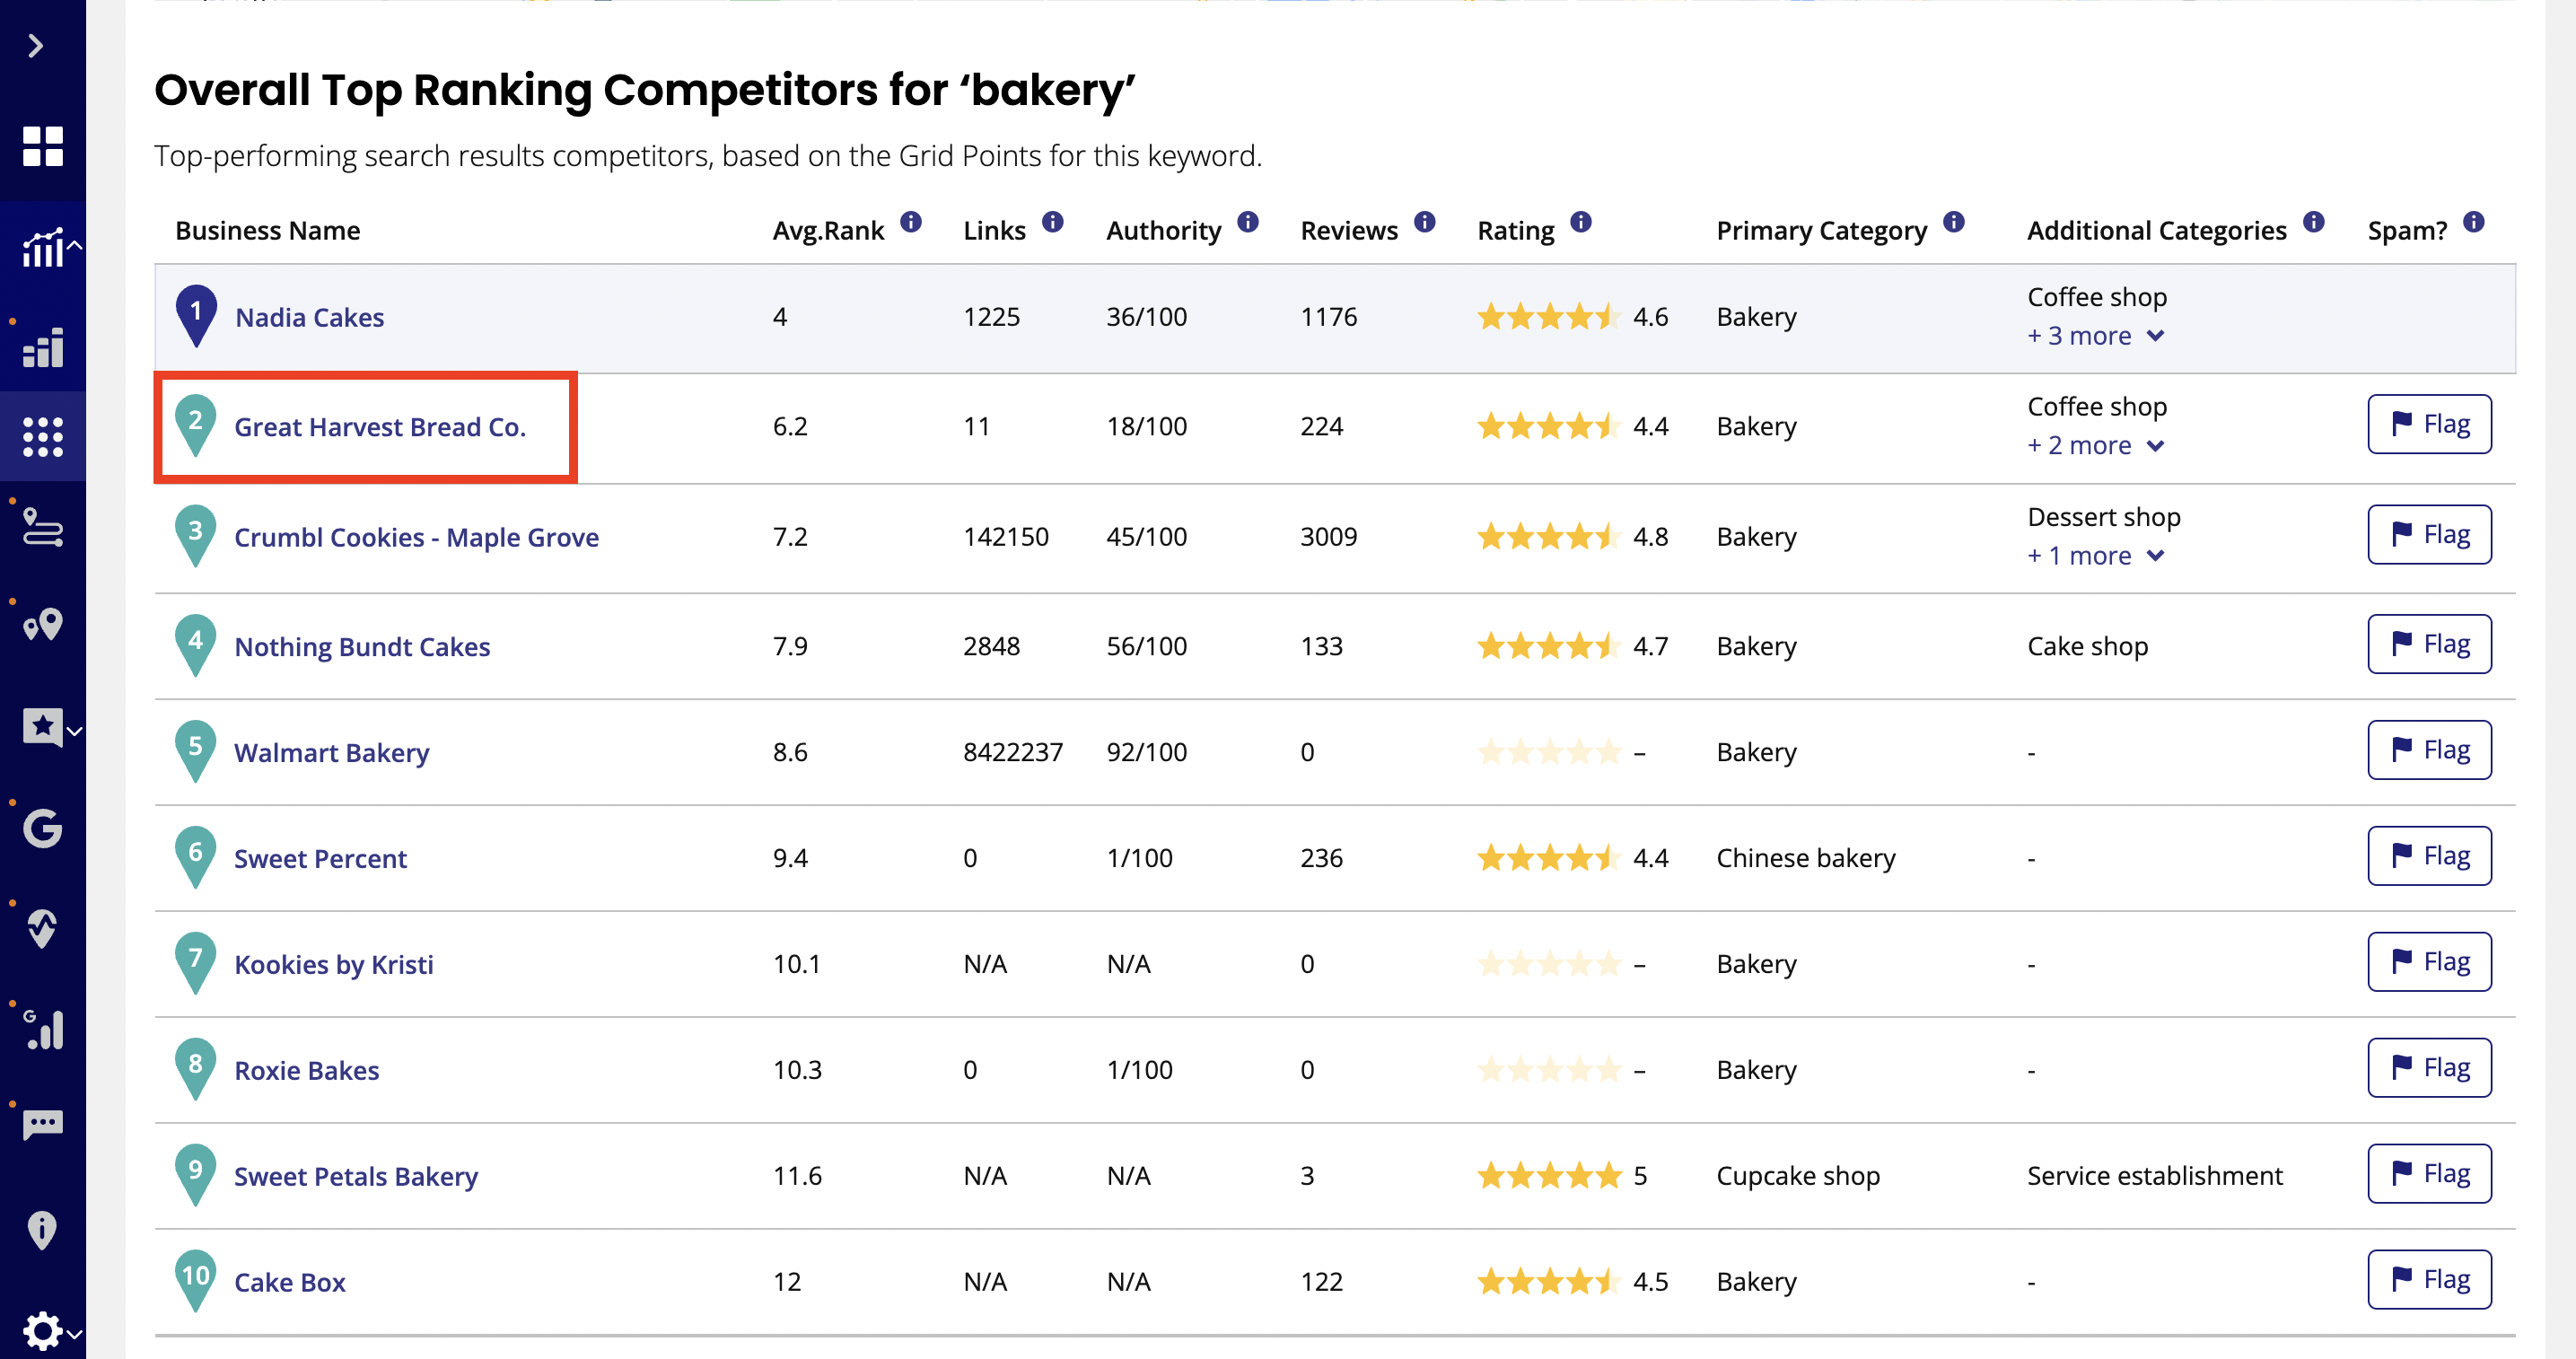
Back in the main report, if you scroll down the next table gives you an even better idea of who you’re actually competing against so you can start to build a strategy for improvement.
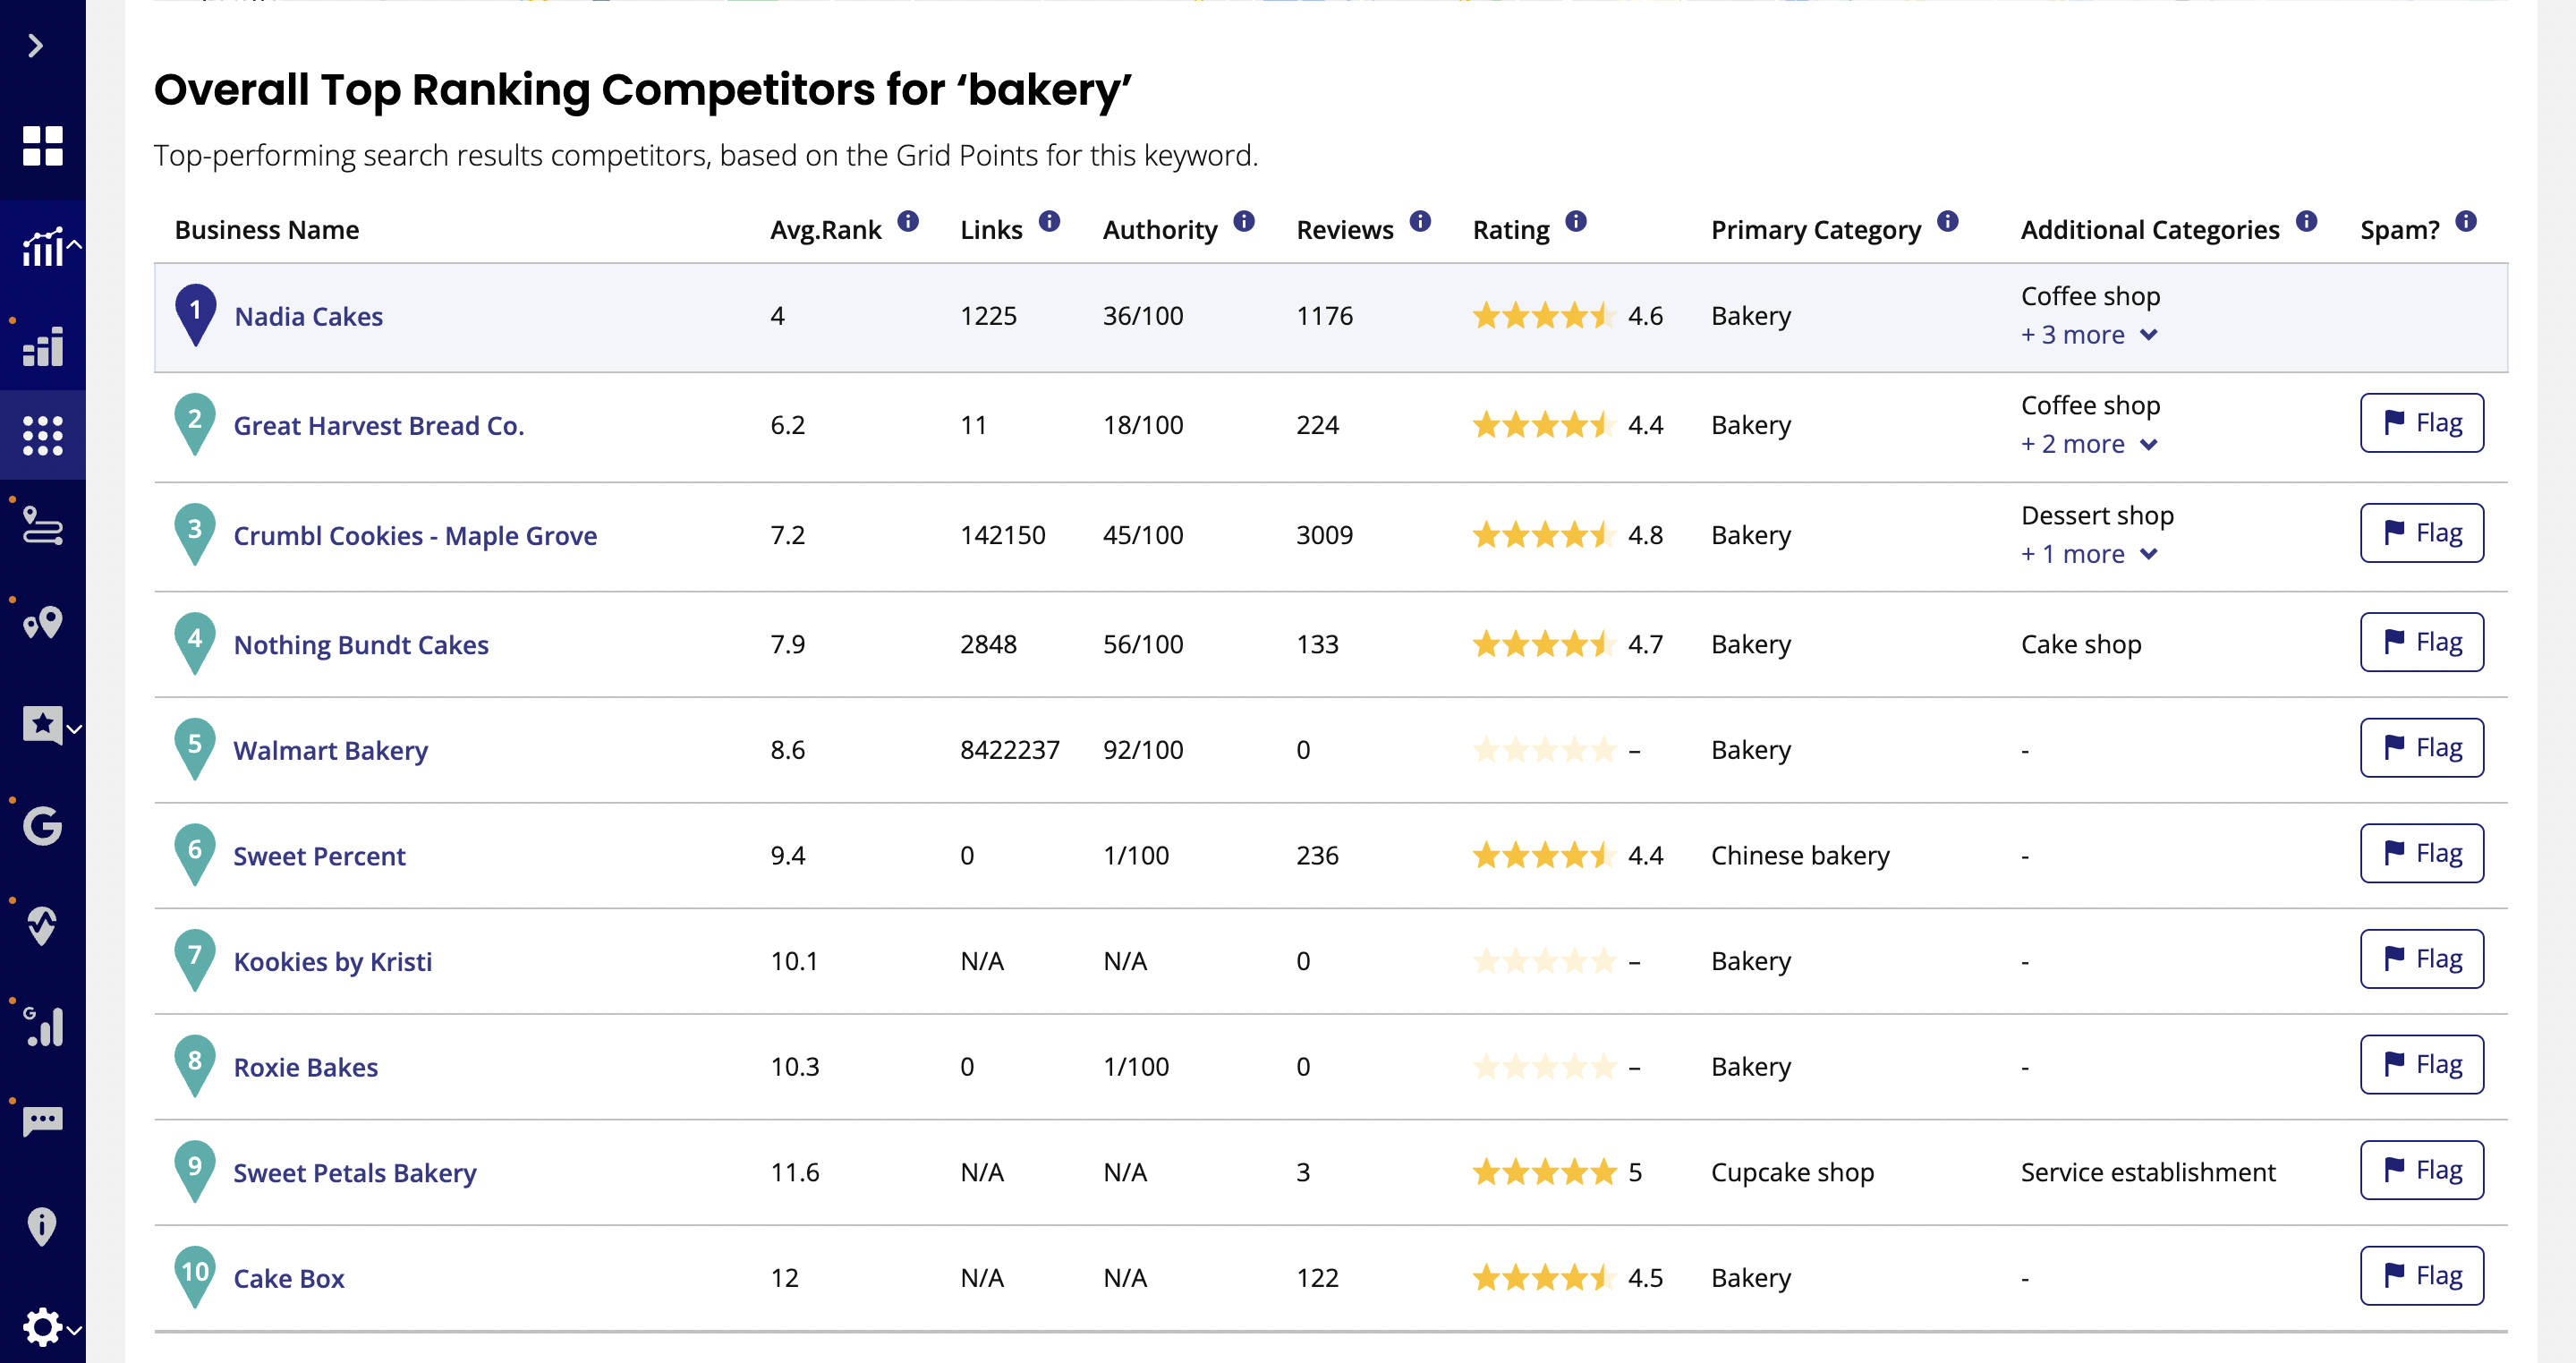
Business Name: This is the business name of the competitor.
Avg Rank: Tells you the competitor’s average ranking in the Local Pack across all grid points for this keyword.
Links: This is the number of backlinks the competitor has (according to Moz) that point to the web domain listed as the website on their Google Business Profile (formerly known as Google My Business).
Authority: This score is a measure taken from Moz. The higher the Authority score the higher the ranking potential of the competitor's website.
Reviews: Gives you the number of customer reviews the competitor has on Google.
Rating: Lets you know the competitor’s average star rating on Google.
Primary Category: Gives you the primary category a competitor is using in their Google Business Profile.
Additional Categories: Gives you the additional categories that a competitor is using in their Google Business Profile.
If you notice in your own report that you have a similar number of reviews and star-ratings as your top competitors but that your category is set to something completely different, you might think about changing the primary category in your Google Business Profile to match theirs so you can try to rank higher.
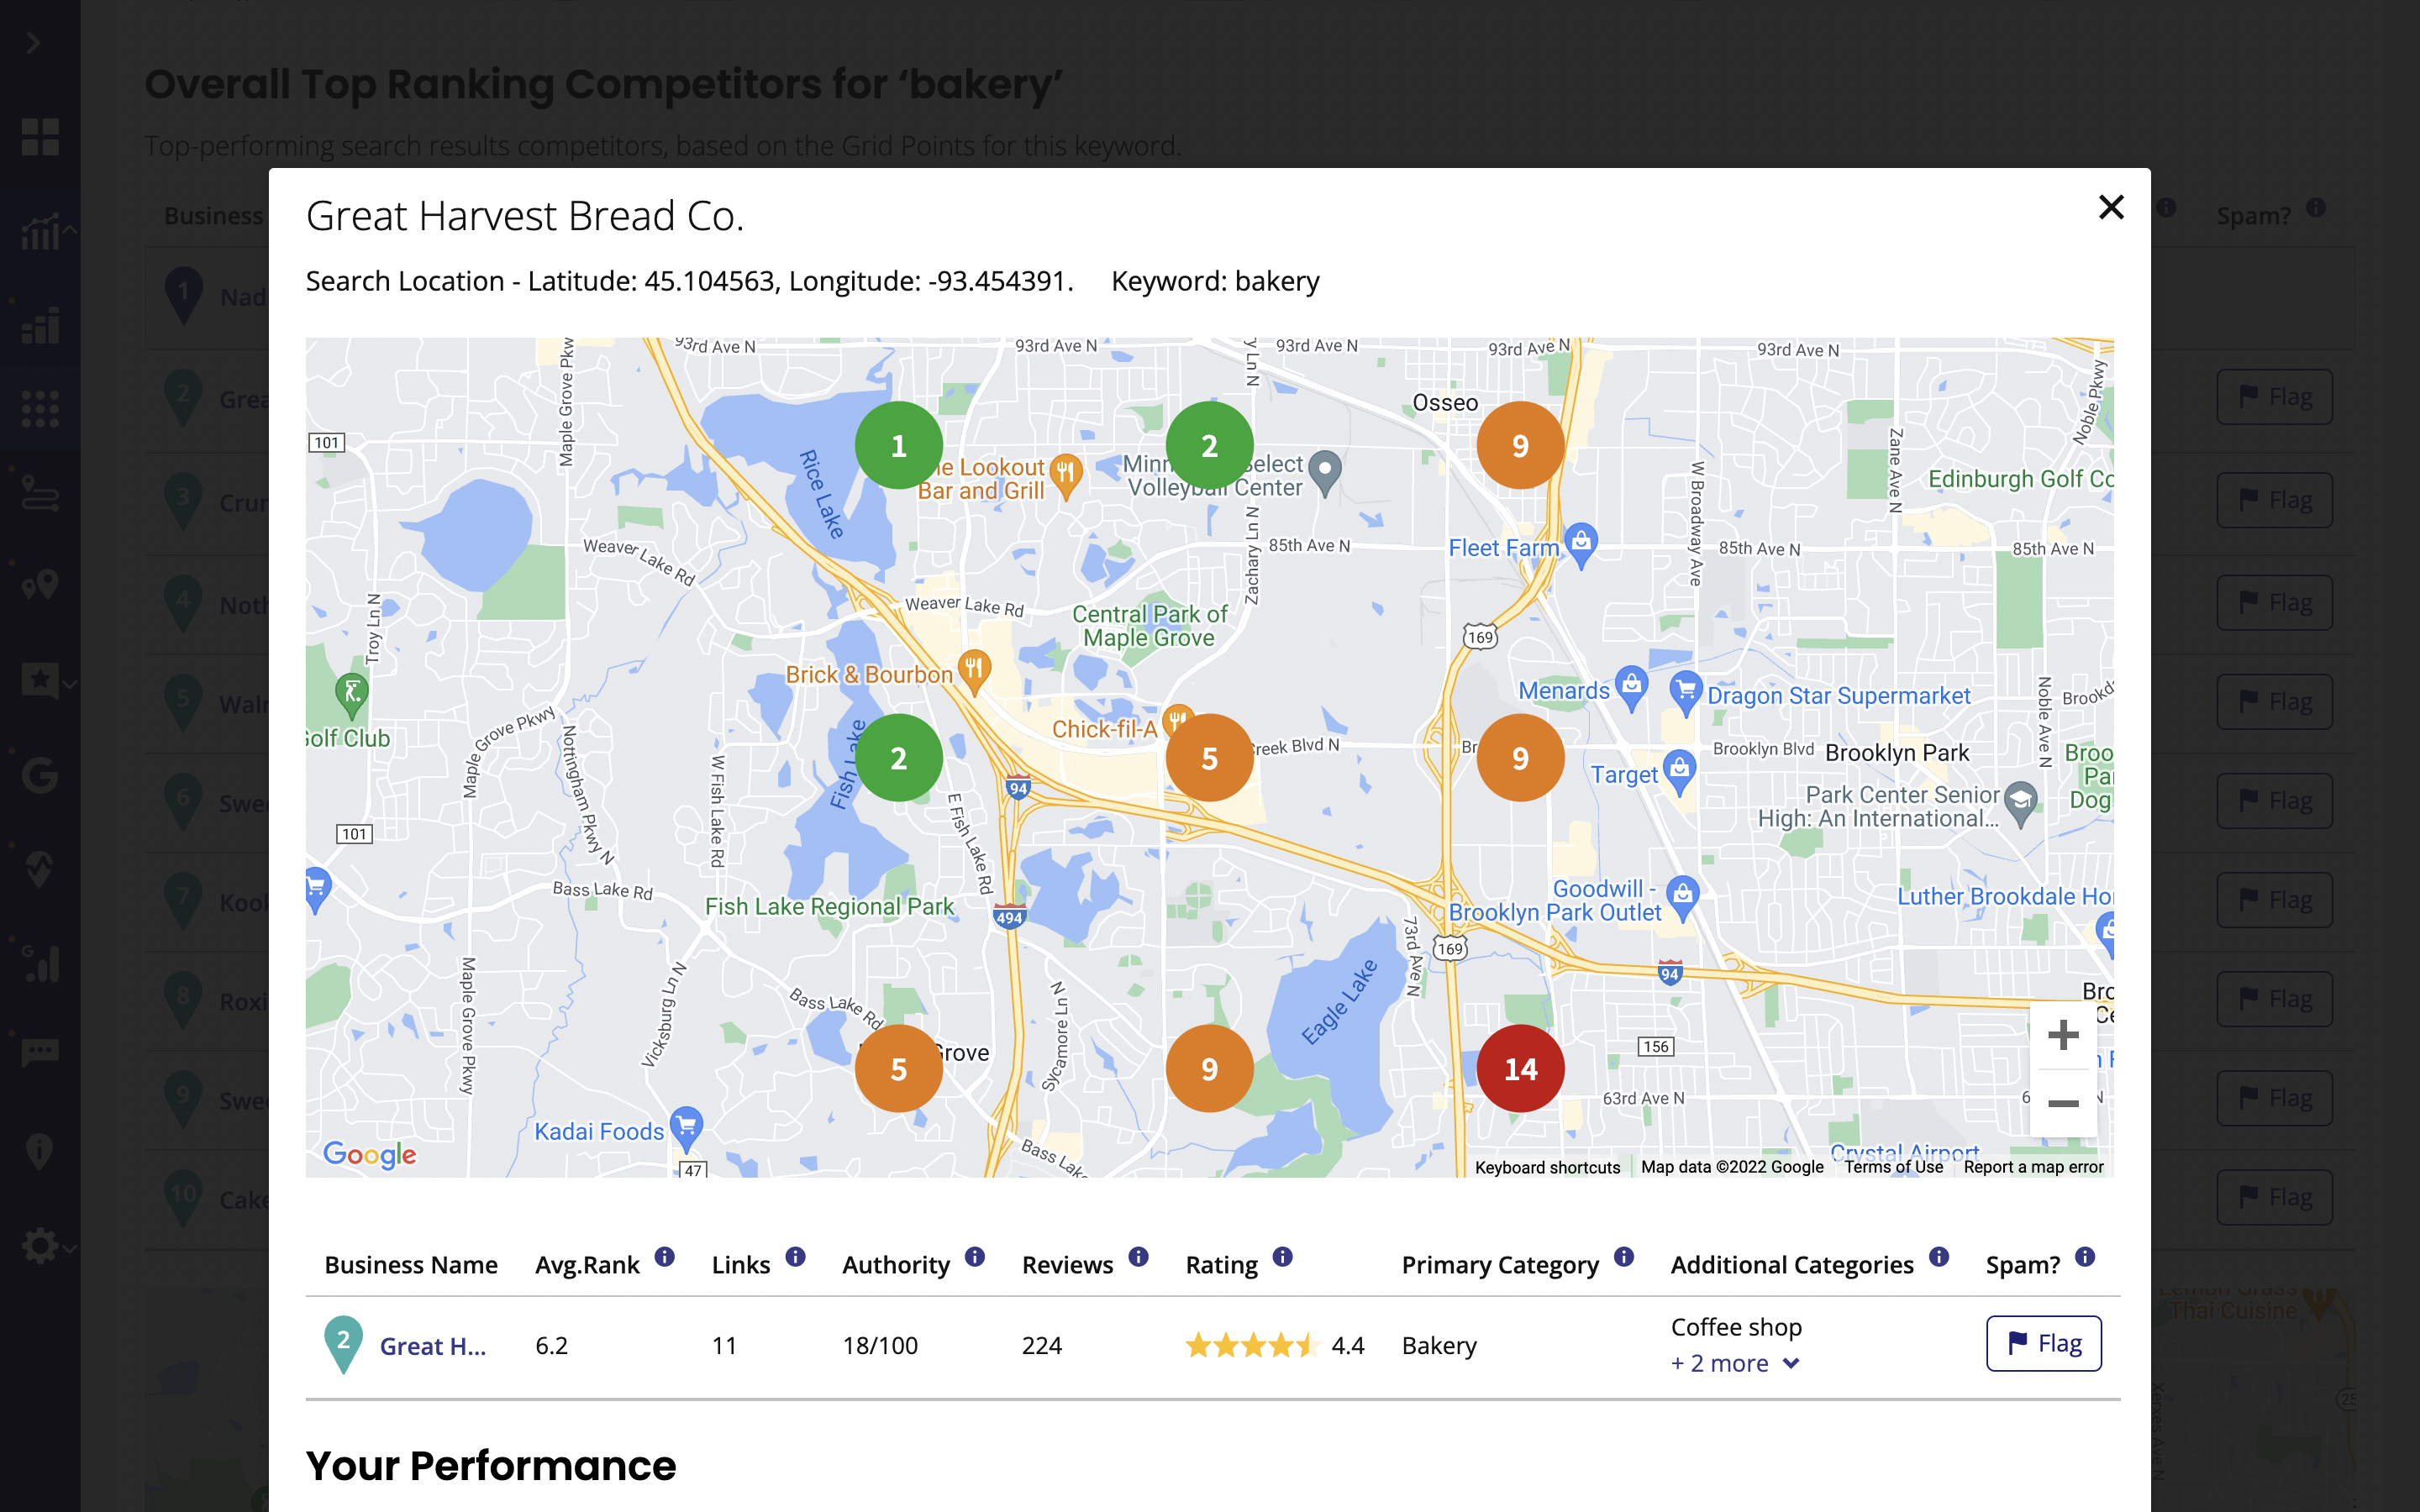
For a side-by-side comparison and to see a competitor's rankings on a grid, click on a competitor's name in the table (as shown in the red box below).
A pop-up will appear showing you the competitor’s rankings by grid points.
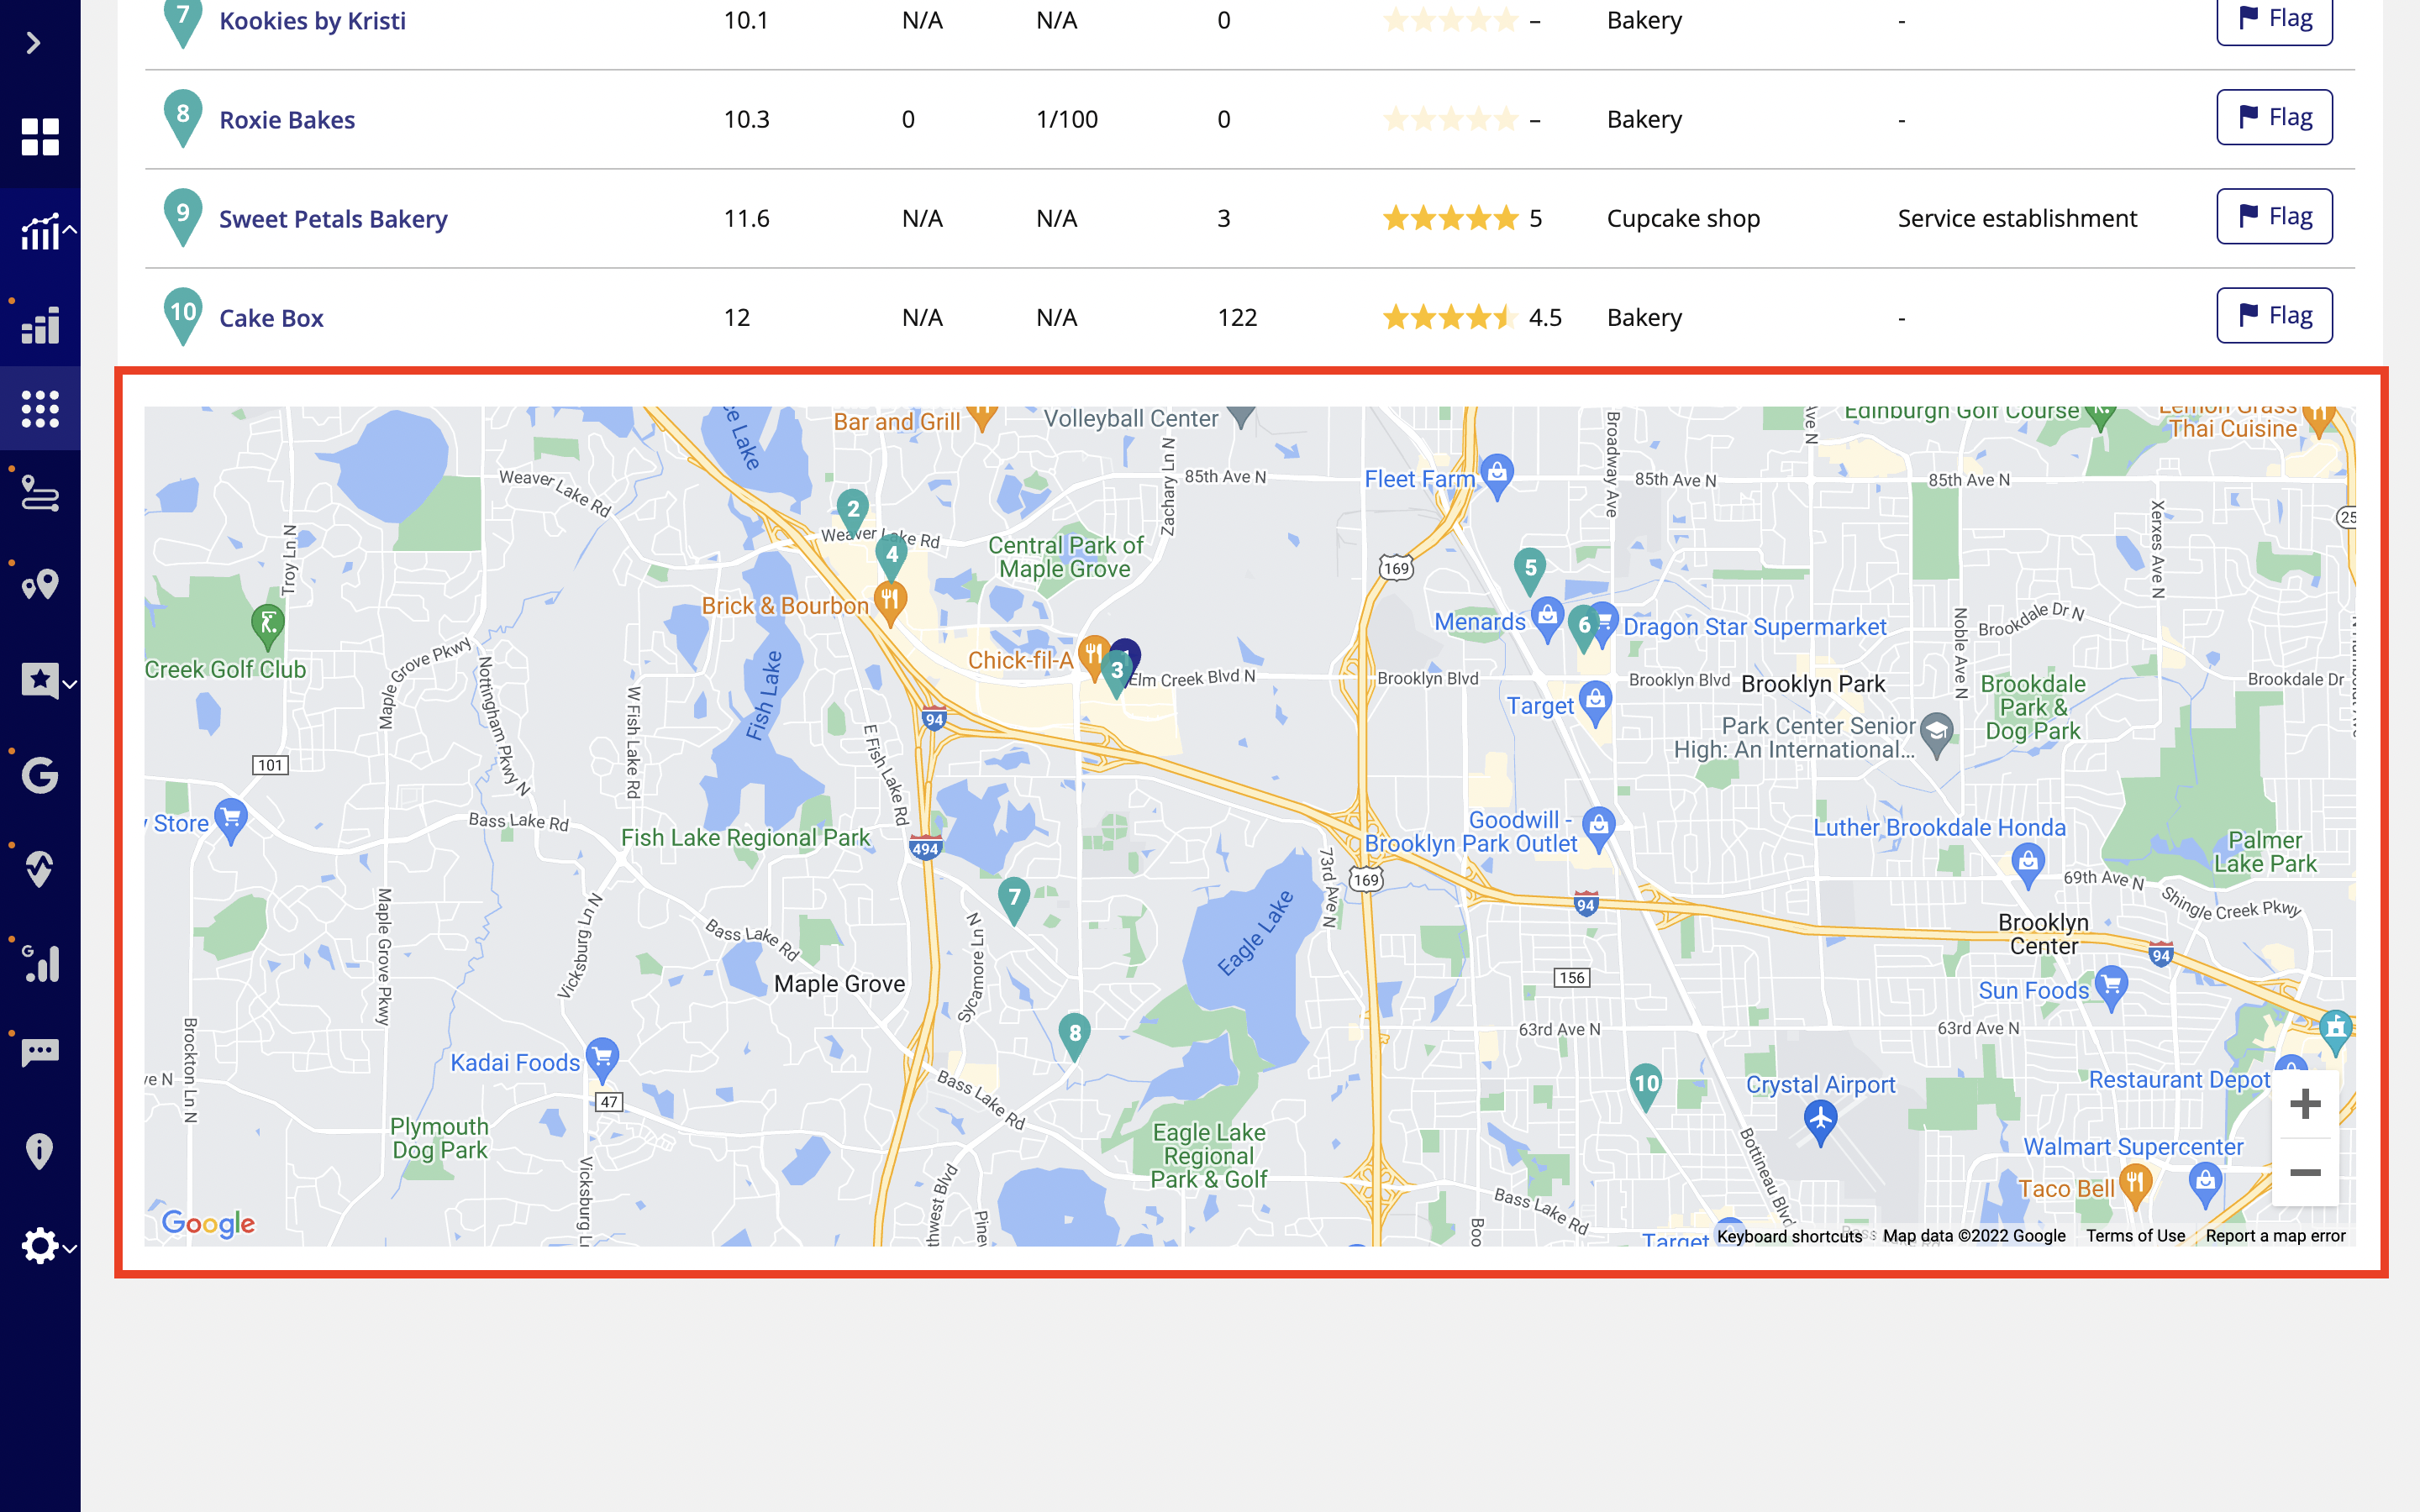
Back in the main report, the map below the table shows you where the competitors in the table are situated, so you can see how close they actually are.
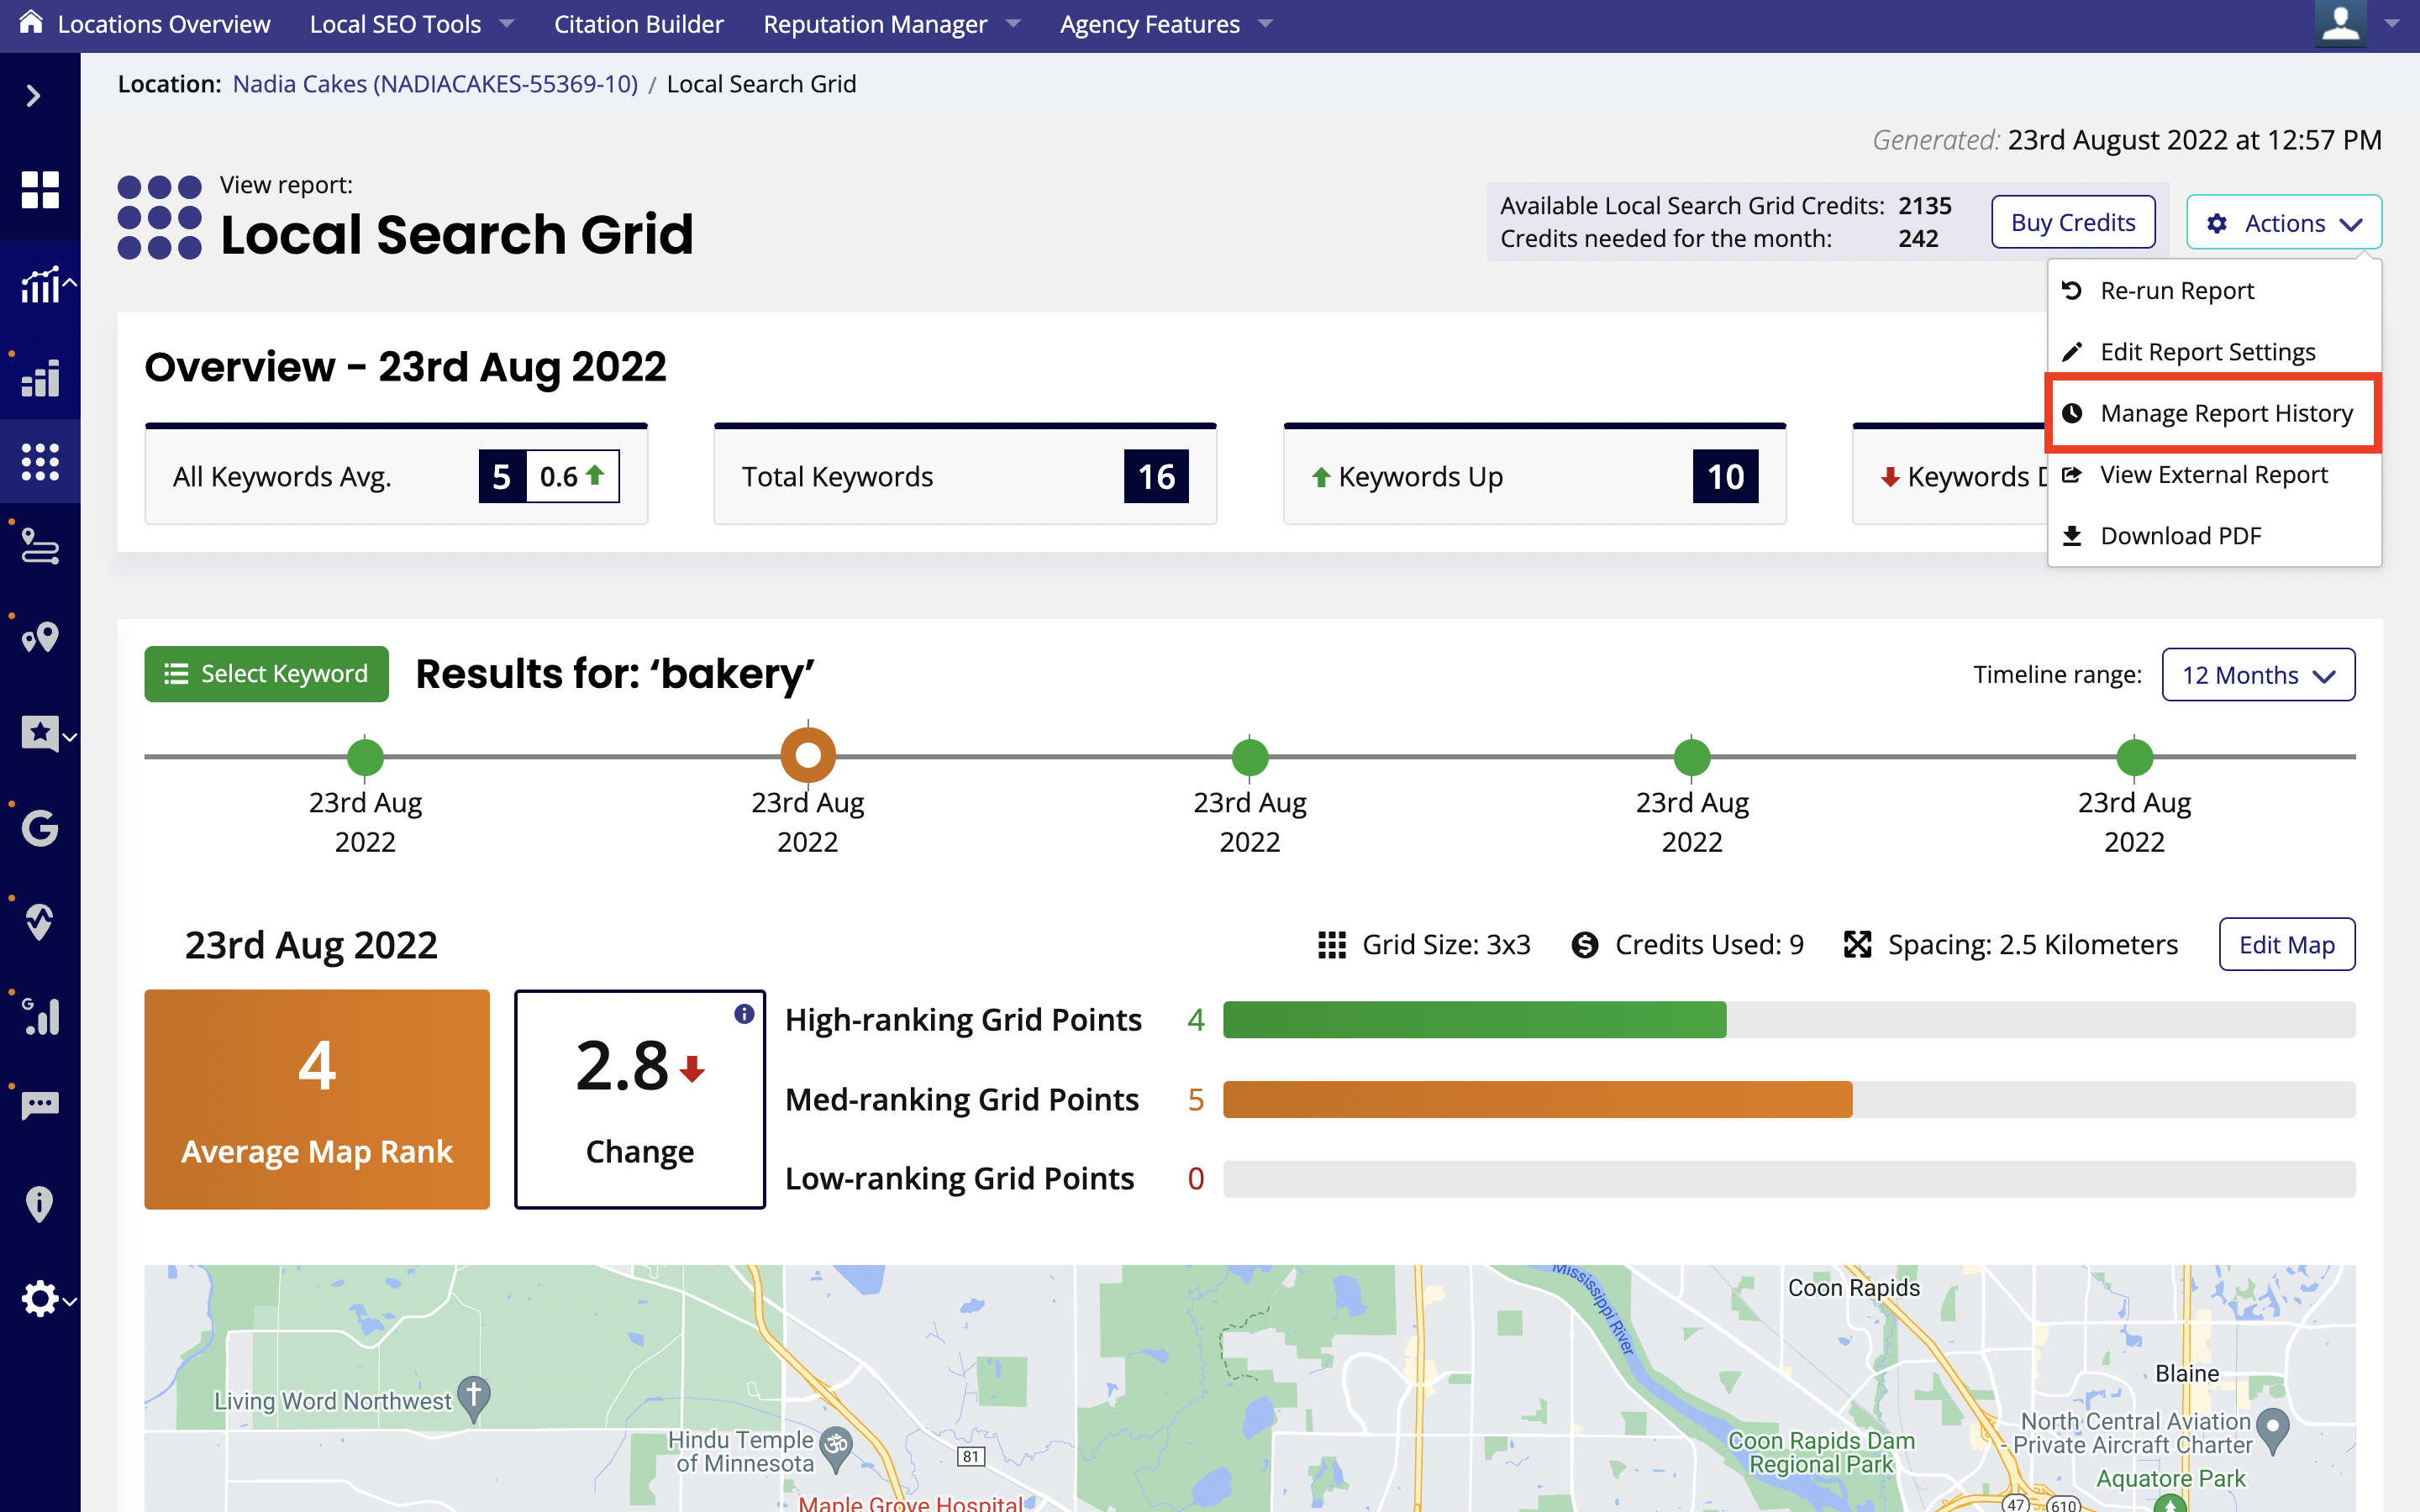
If at any time you want to edit or re-run the report, simply click the ‘Actions’ button.
You can also archive specific report runs so they don't appear in the timeline.
Simply click on 'Manage Report History' from within the 'Actions' button dropdown and a page will open showing all of the reports run so far.
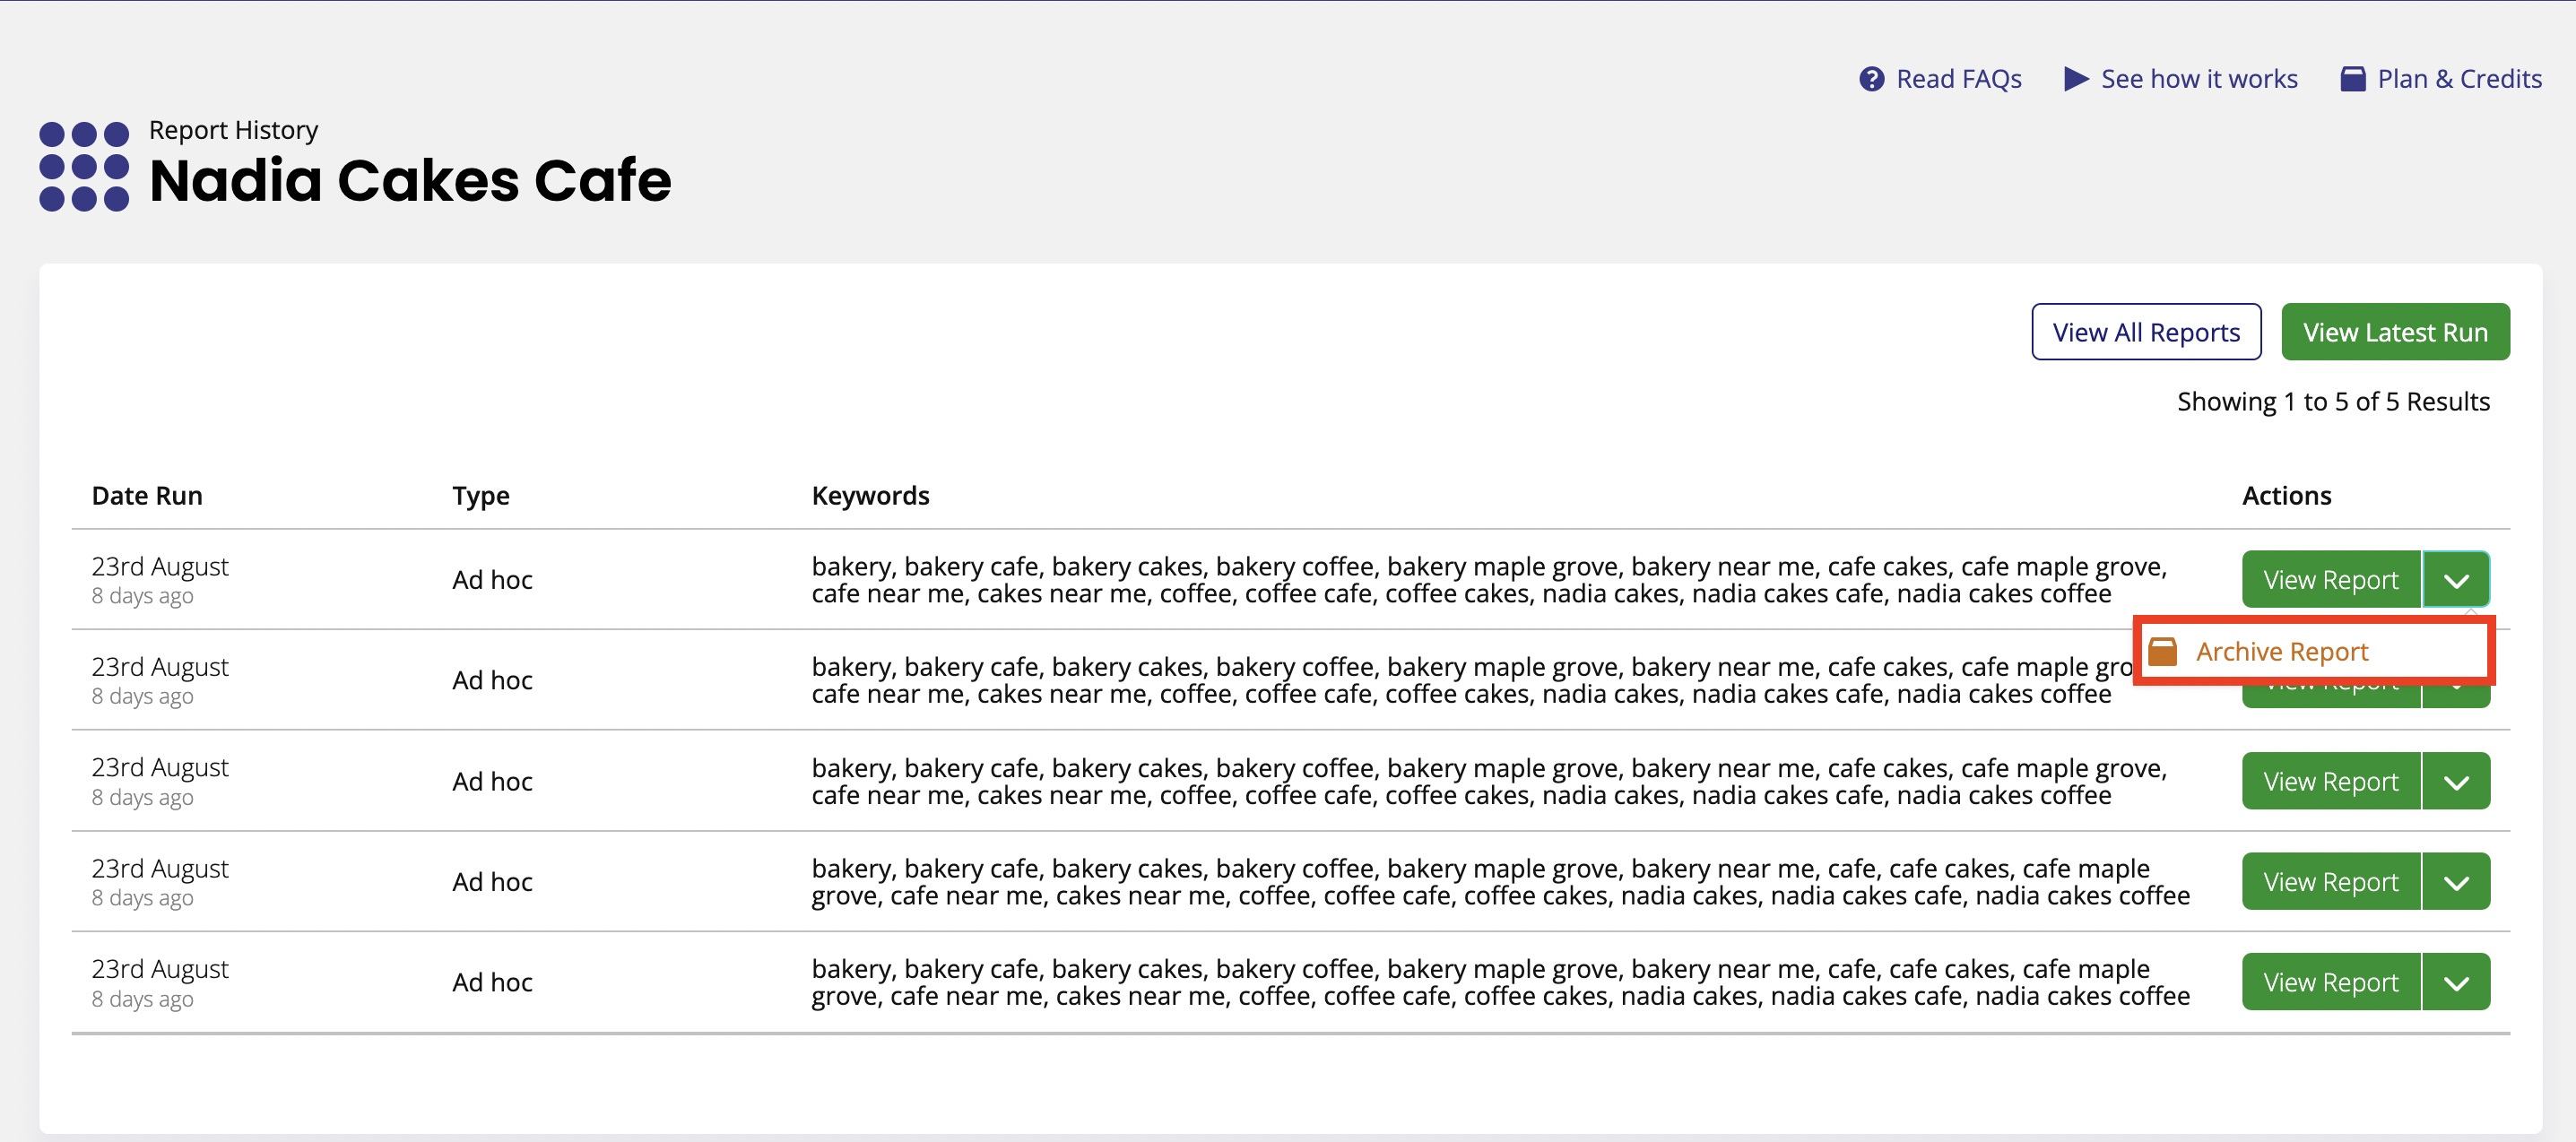
Then click the arrow button next to the report that you want to archive and select 'Archive report'.
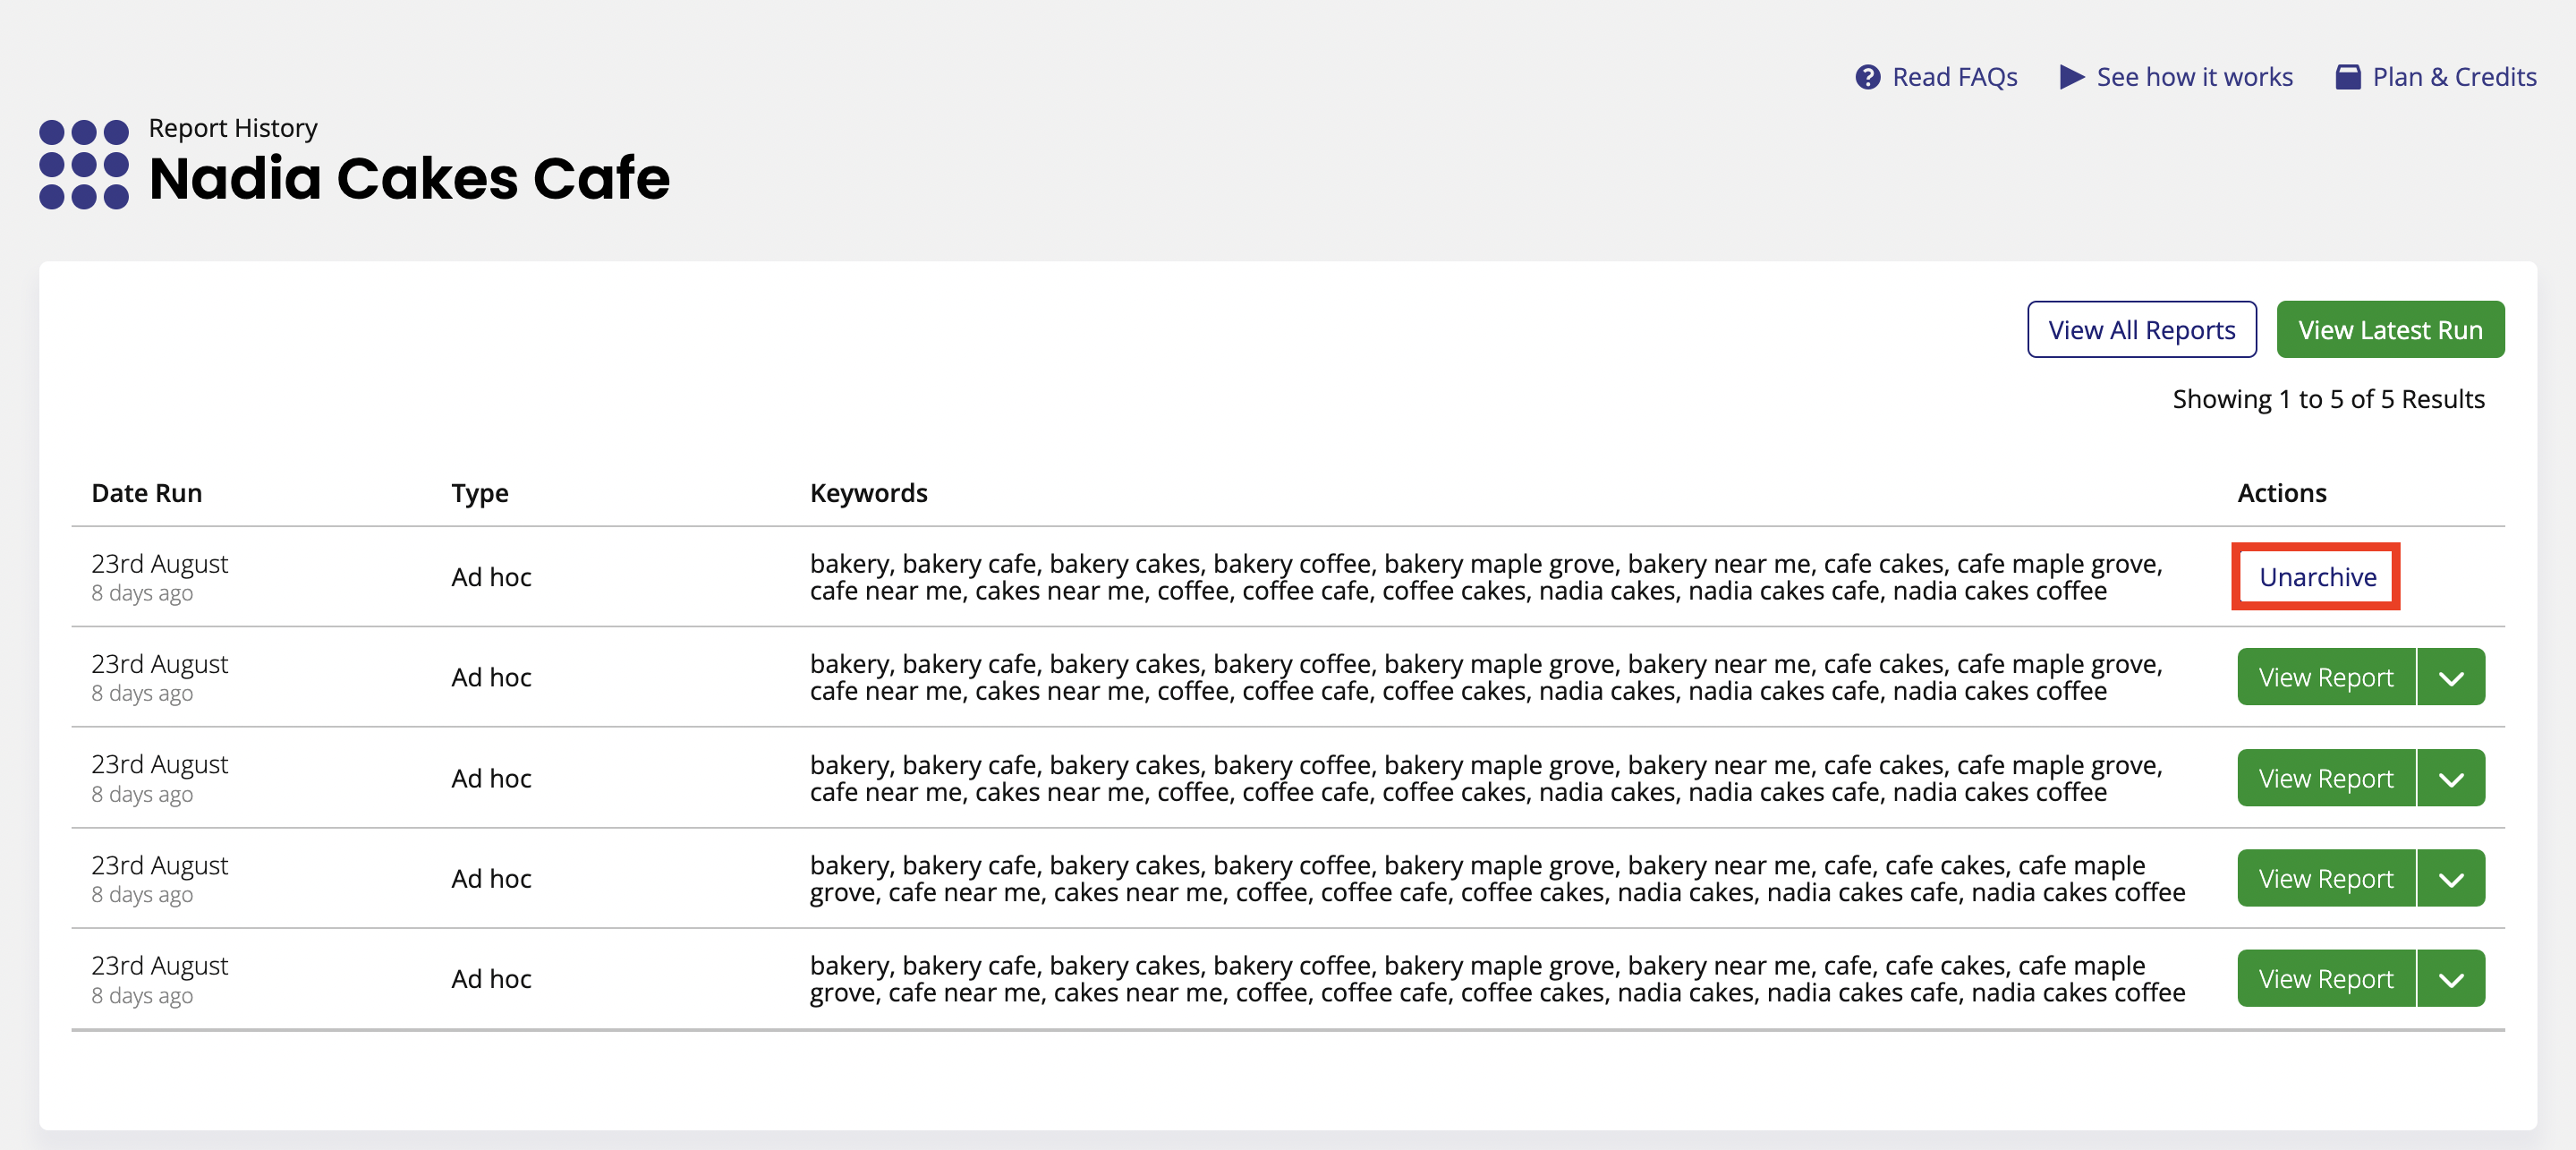
The report will now have been removed from the timeline in the main report.
To reinstate the archived report at any time, simply return to the 'Manage Report History' page and click 'Unarchive'.
If you want to download a PDF of the report, click the 'Actions' button and then select that option from the dropdown.
Was this article helpful?
That’s Great!
Thank you for your feedback
Sorry! We couldn't be helpful
Thank you for your feedback
Feedback sent
We appreciate your effort and will try to fix the article