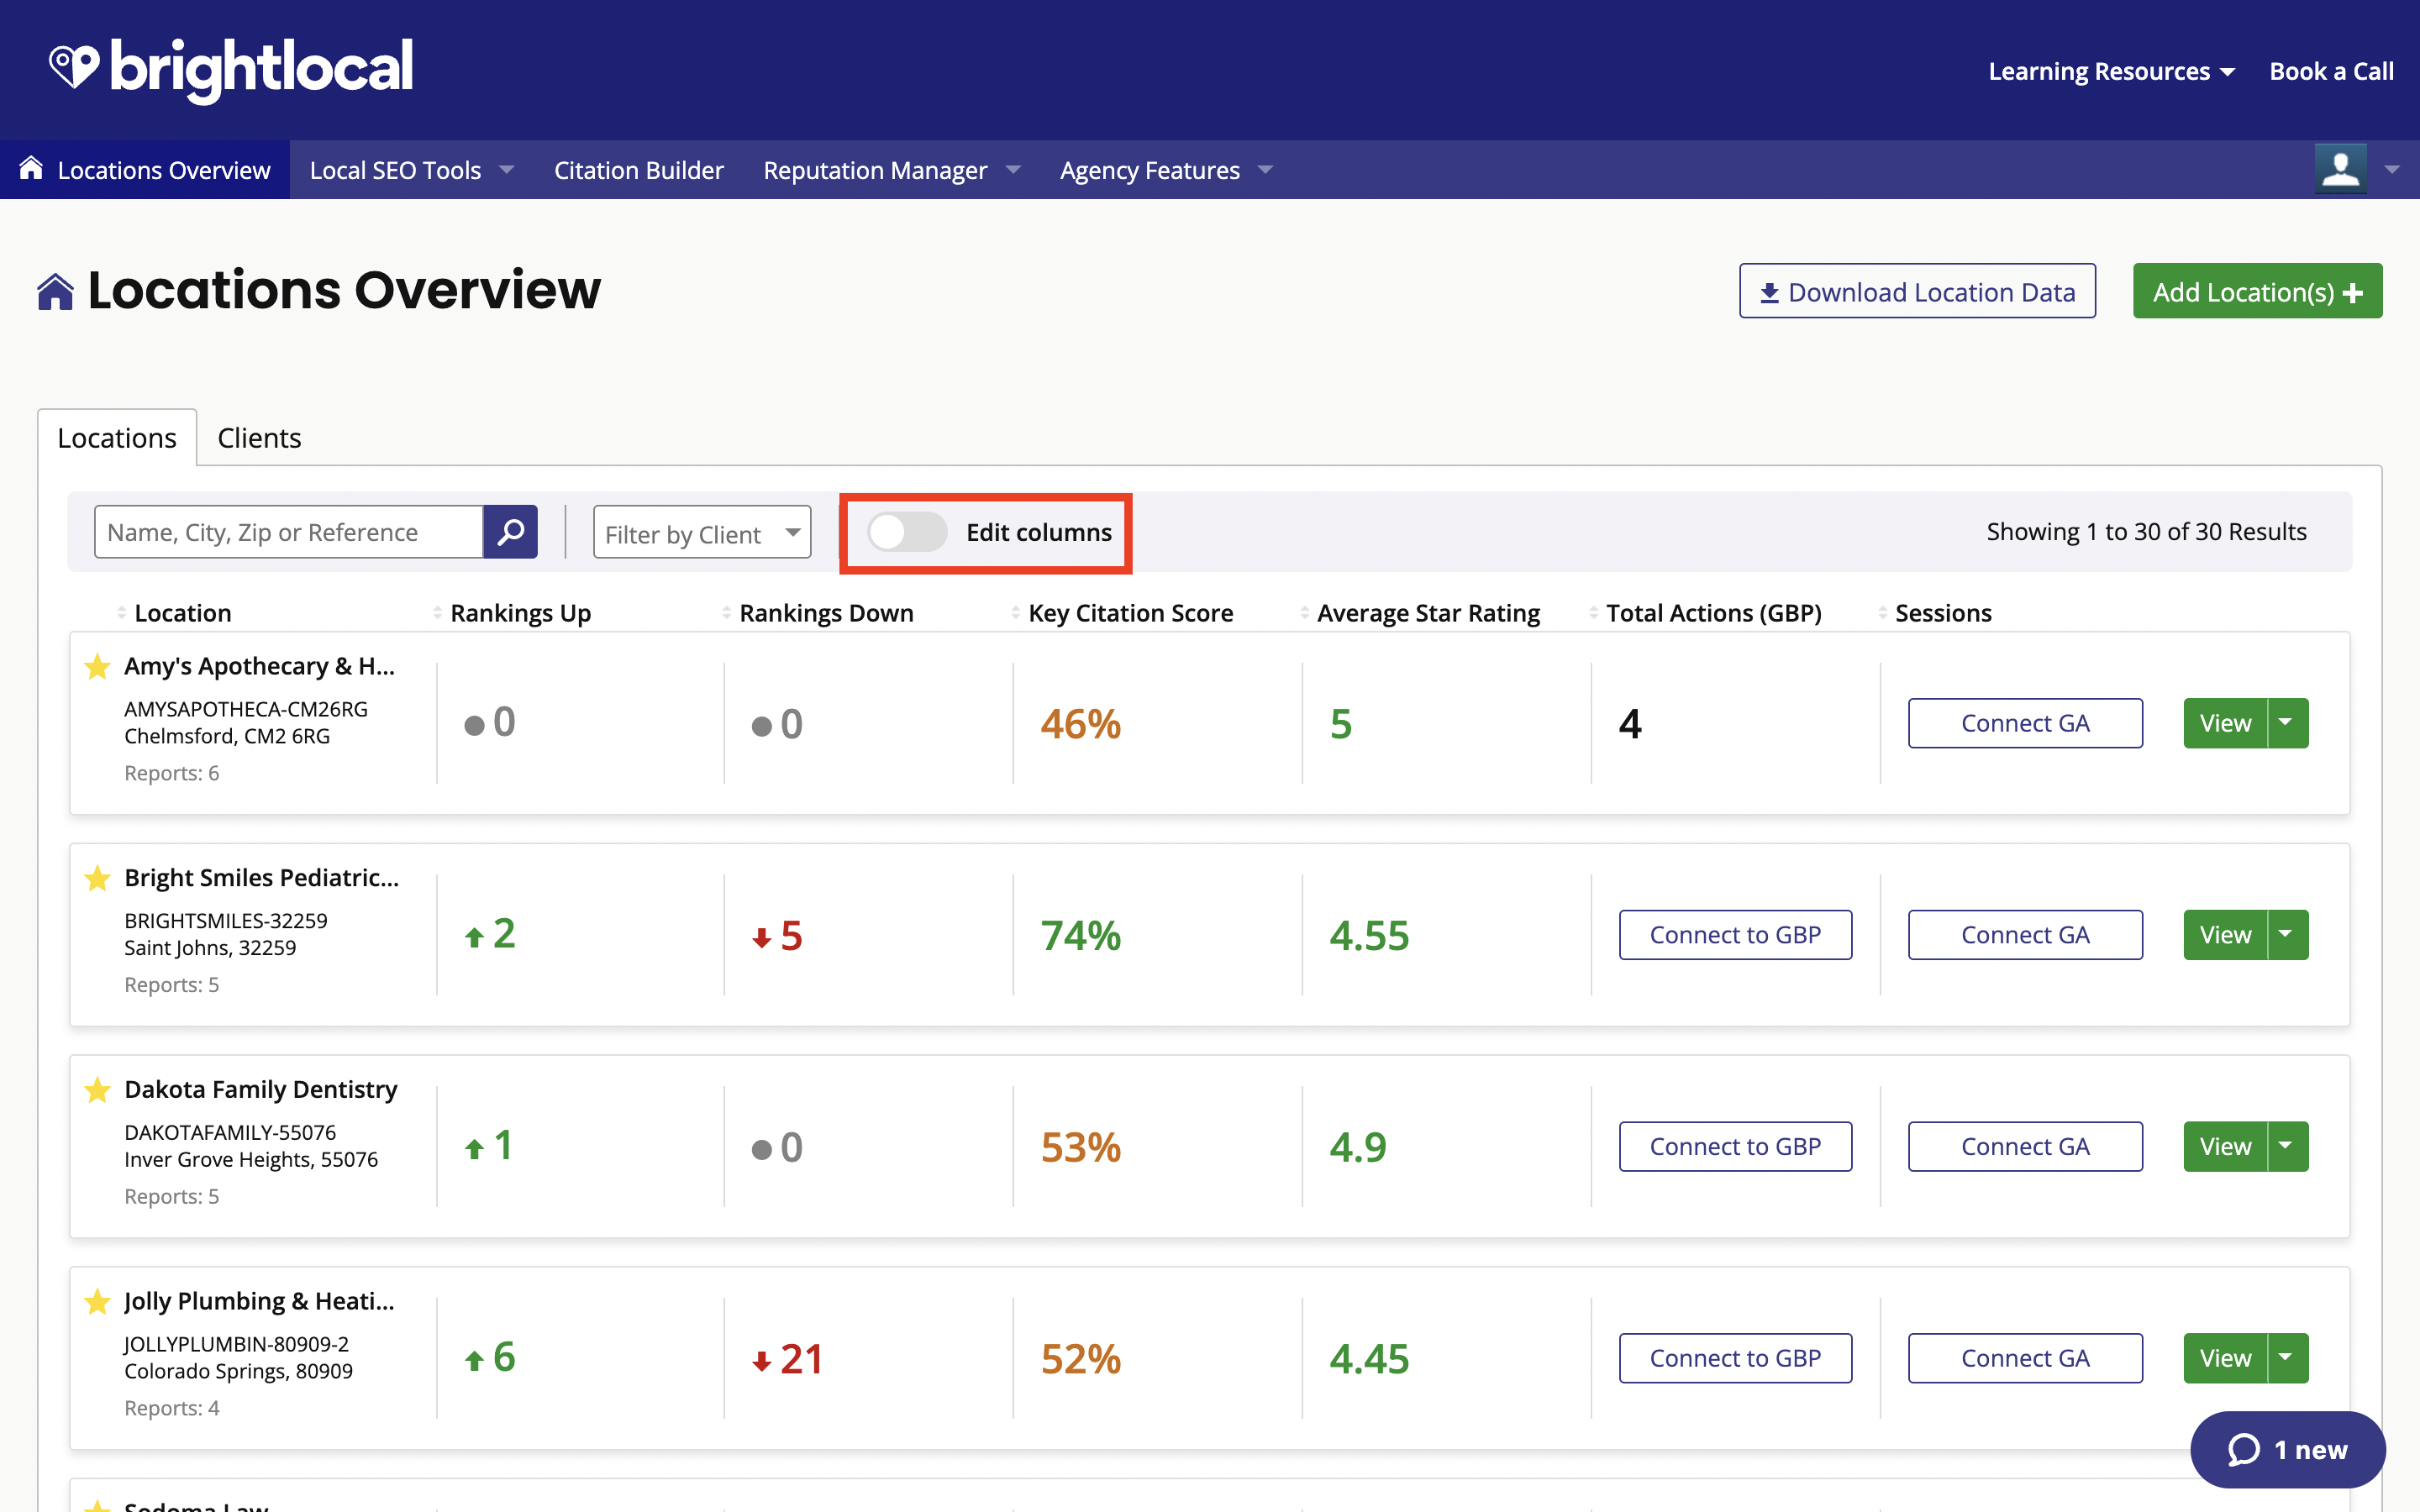
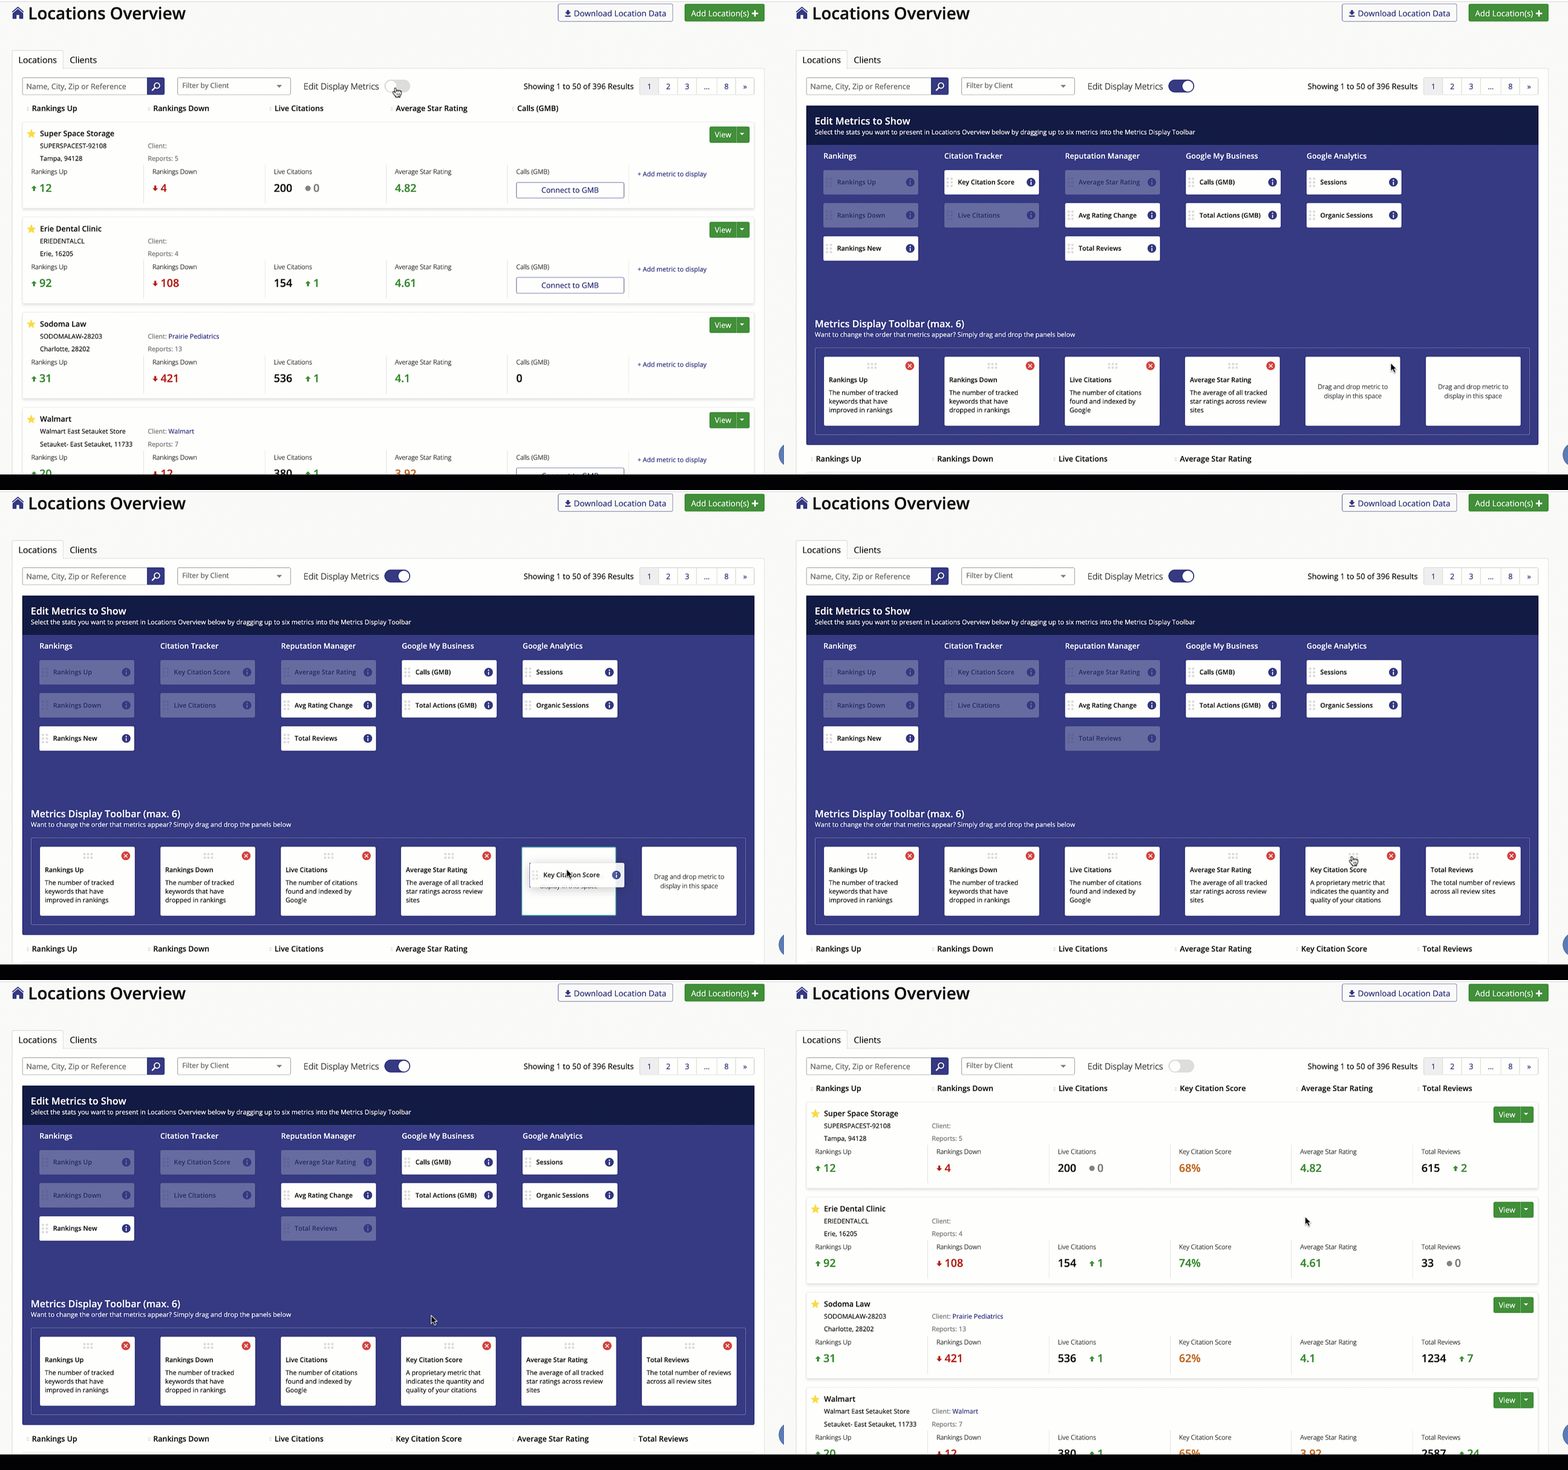
To edit the metrics that are displayed for each Location, turn on the ‘Edit columns’ toggle.

Next, select the stats you want to present by dragging them into the Metrics Display Toolbar below. You can add up to 6 metrics for each Location.

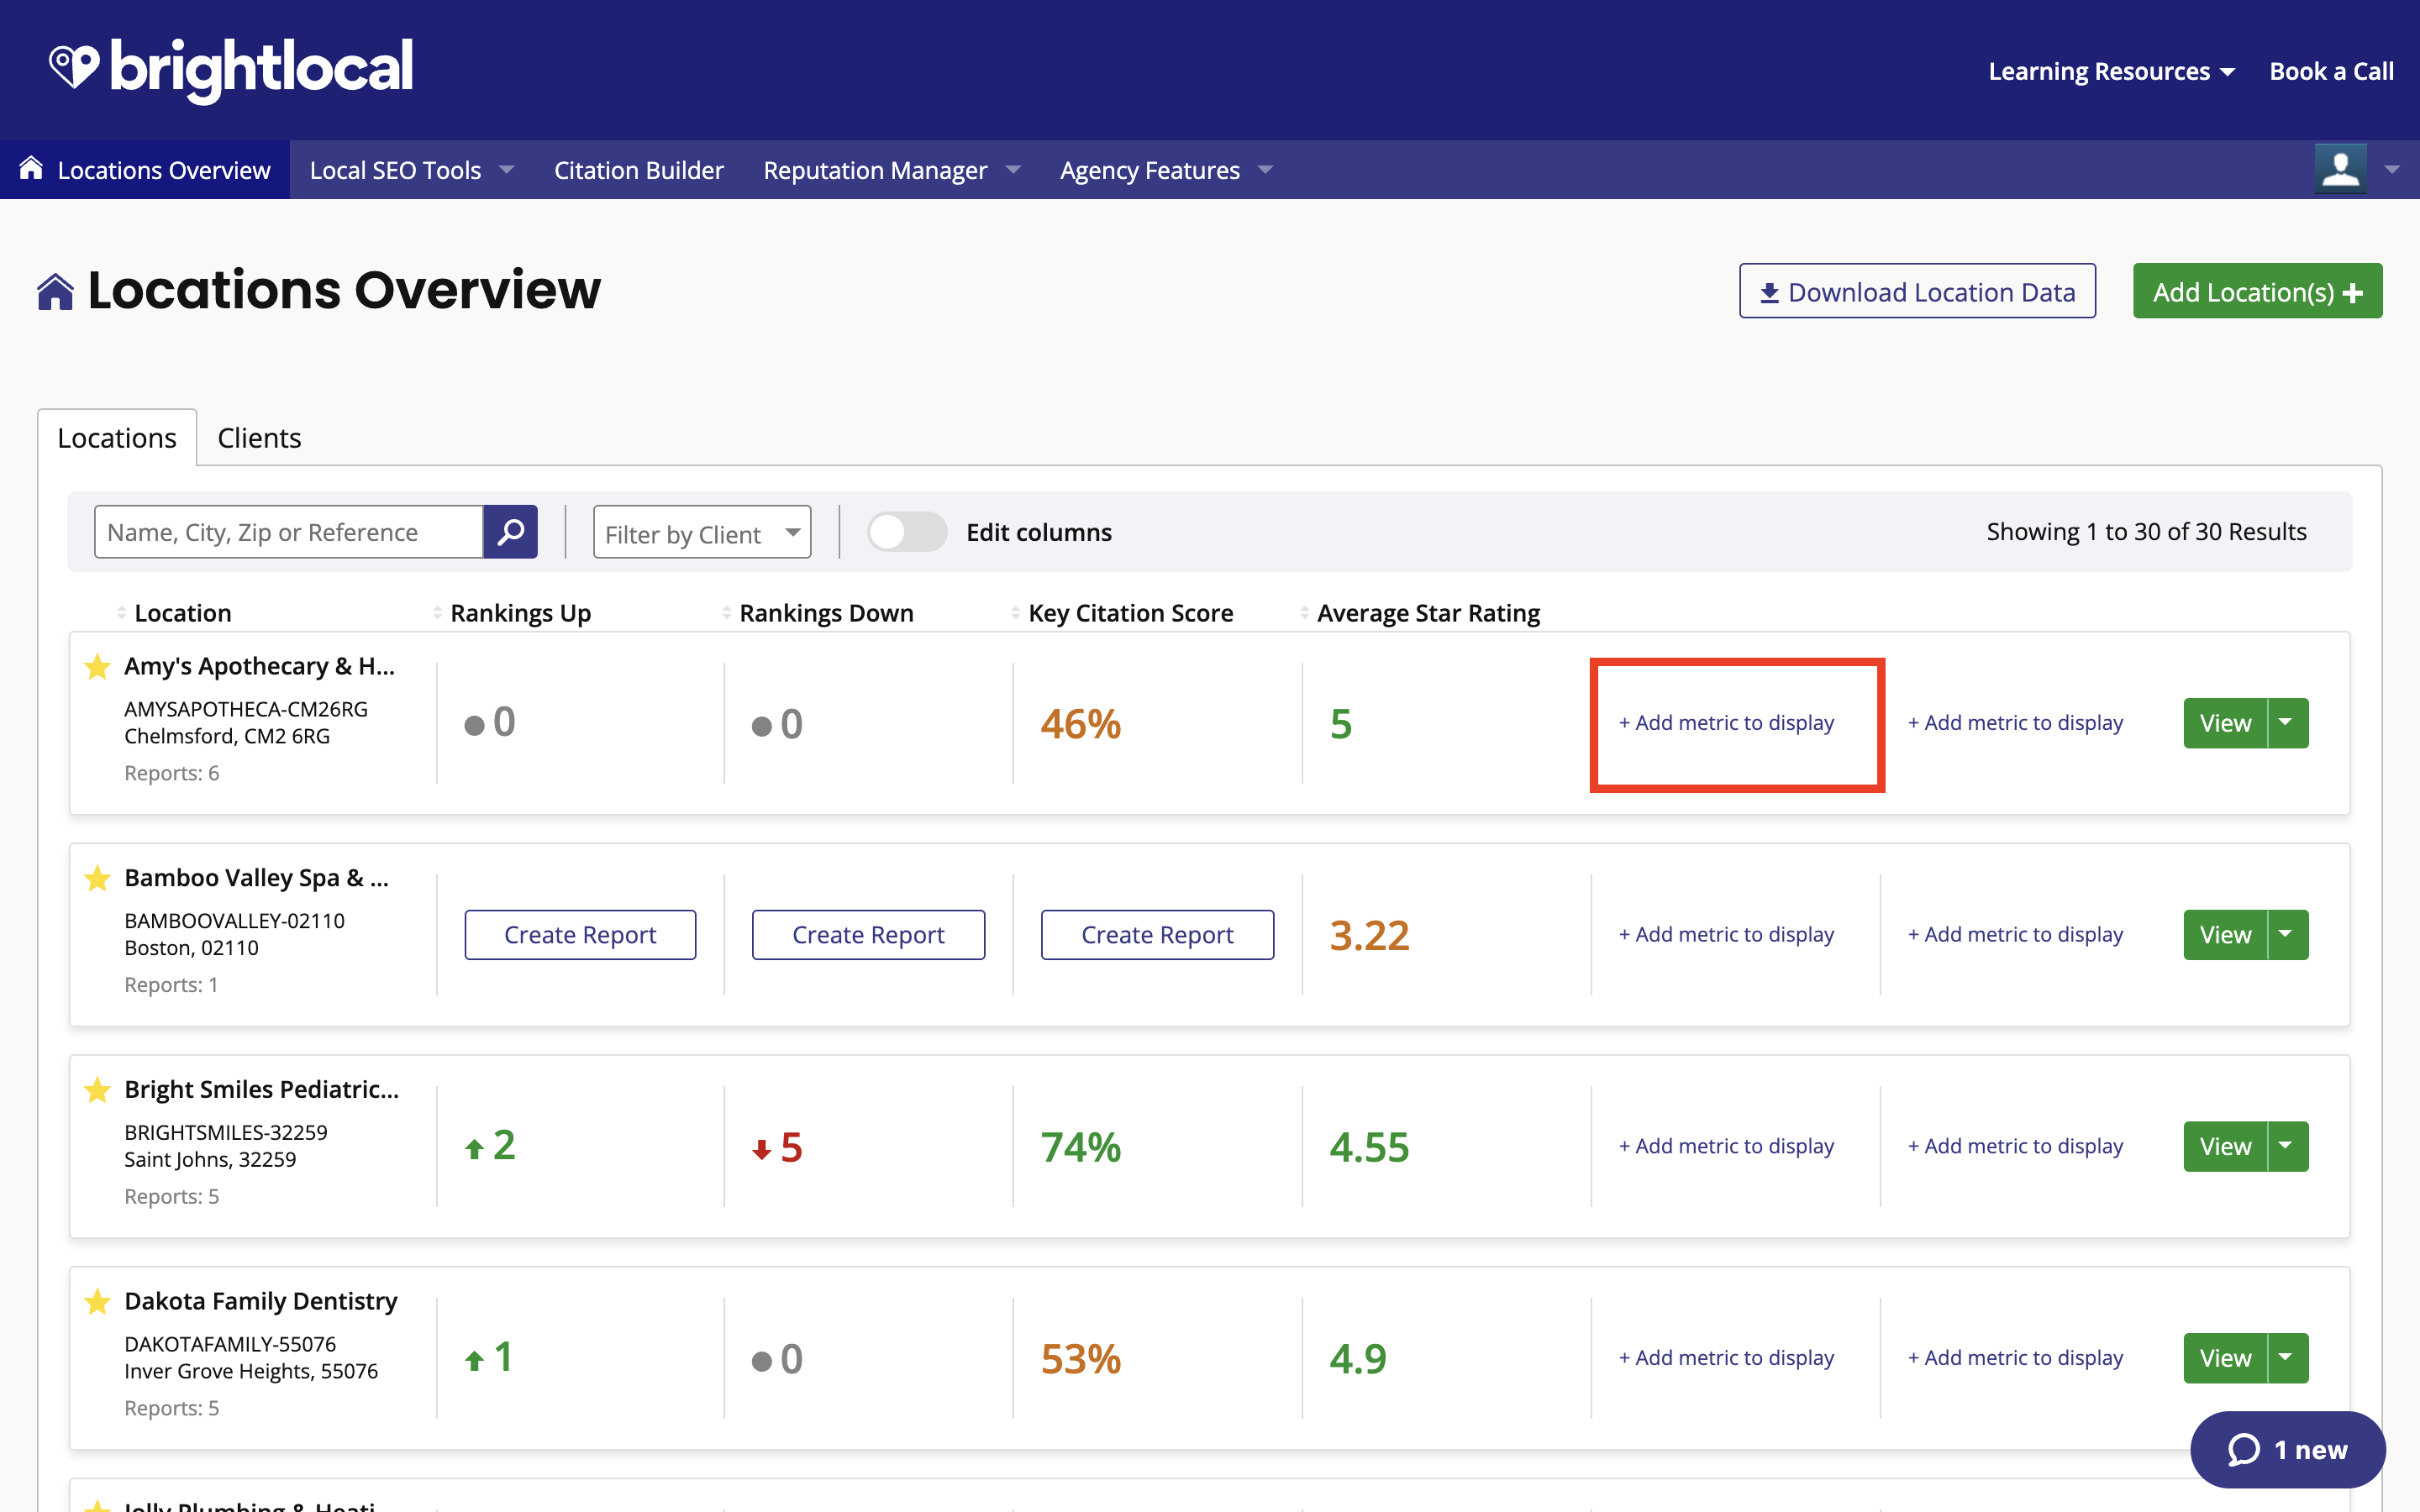
You can also add metrics by clicking the ‘Add metric to display' button. This will only appear if you haven’t already chosen 6 metrics display.

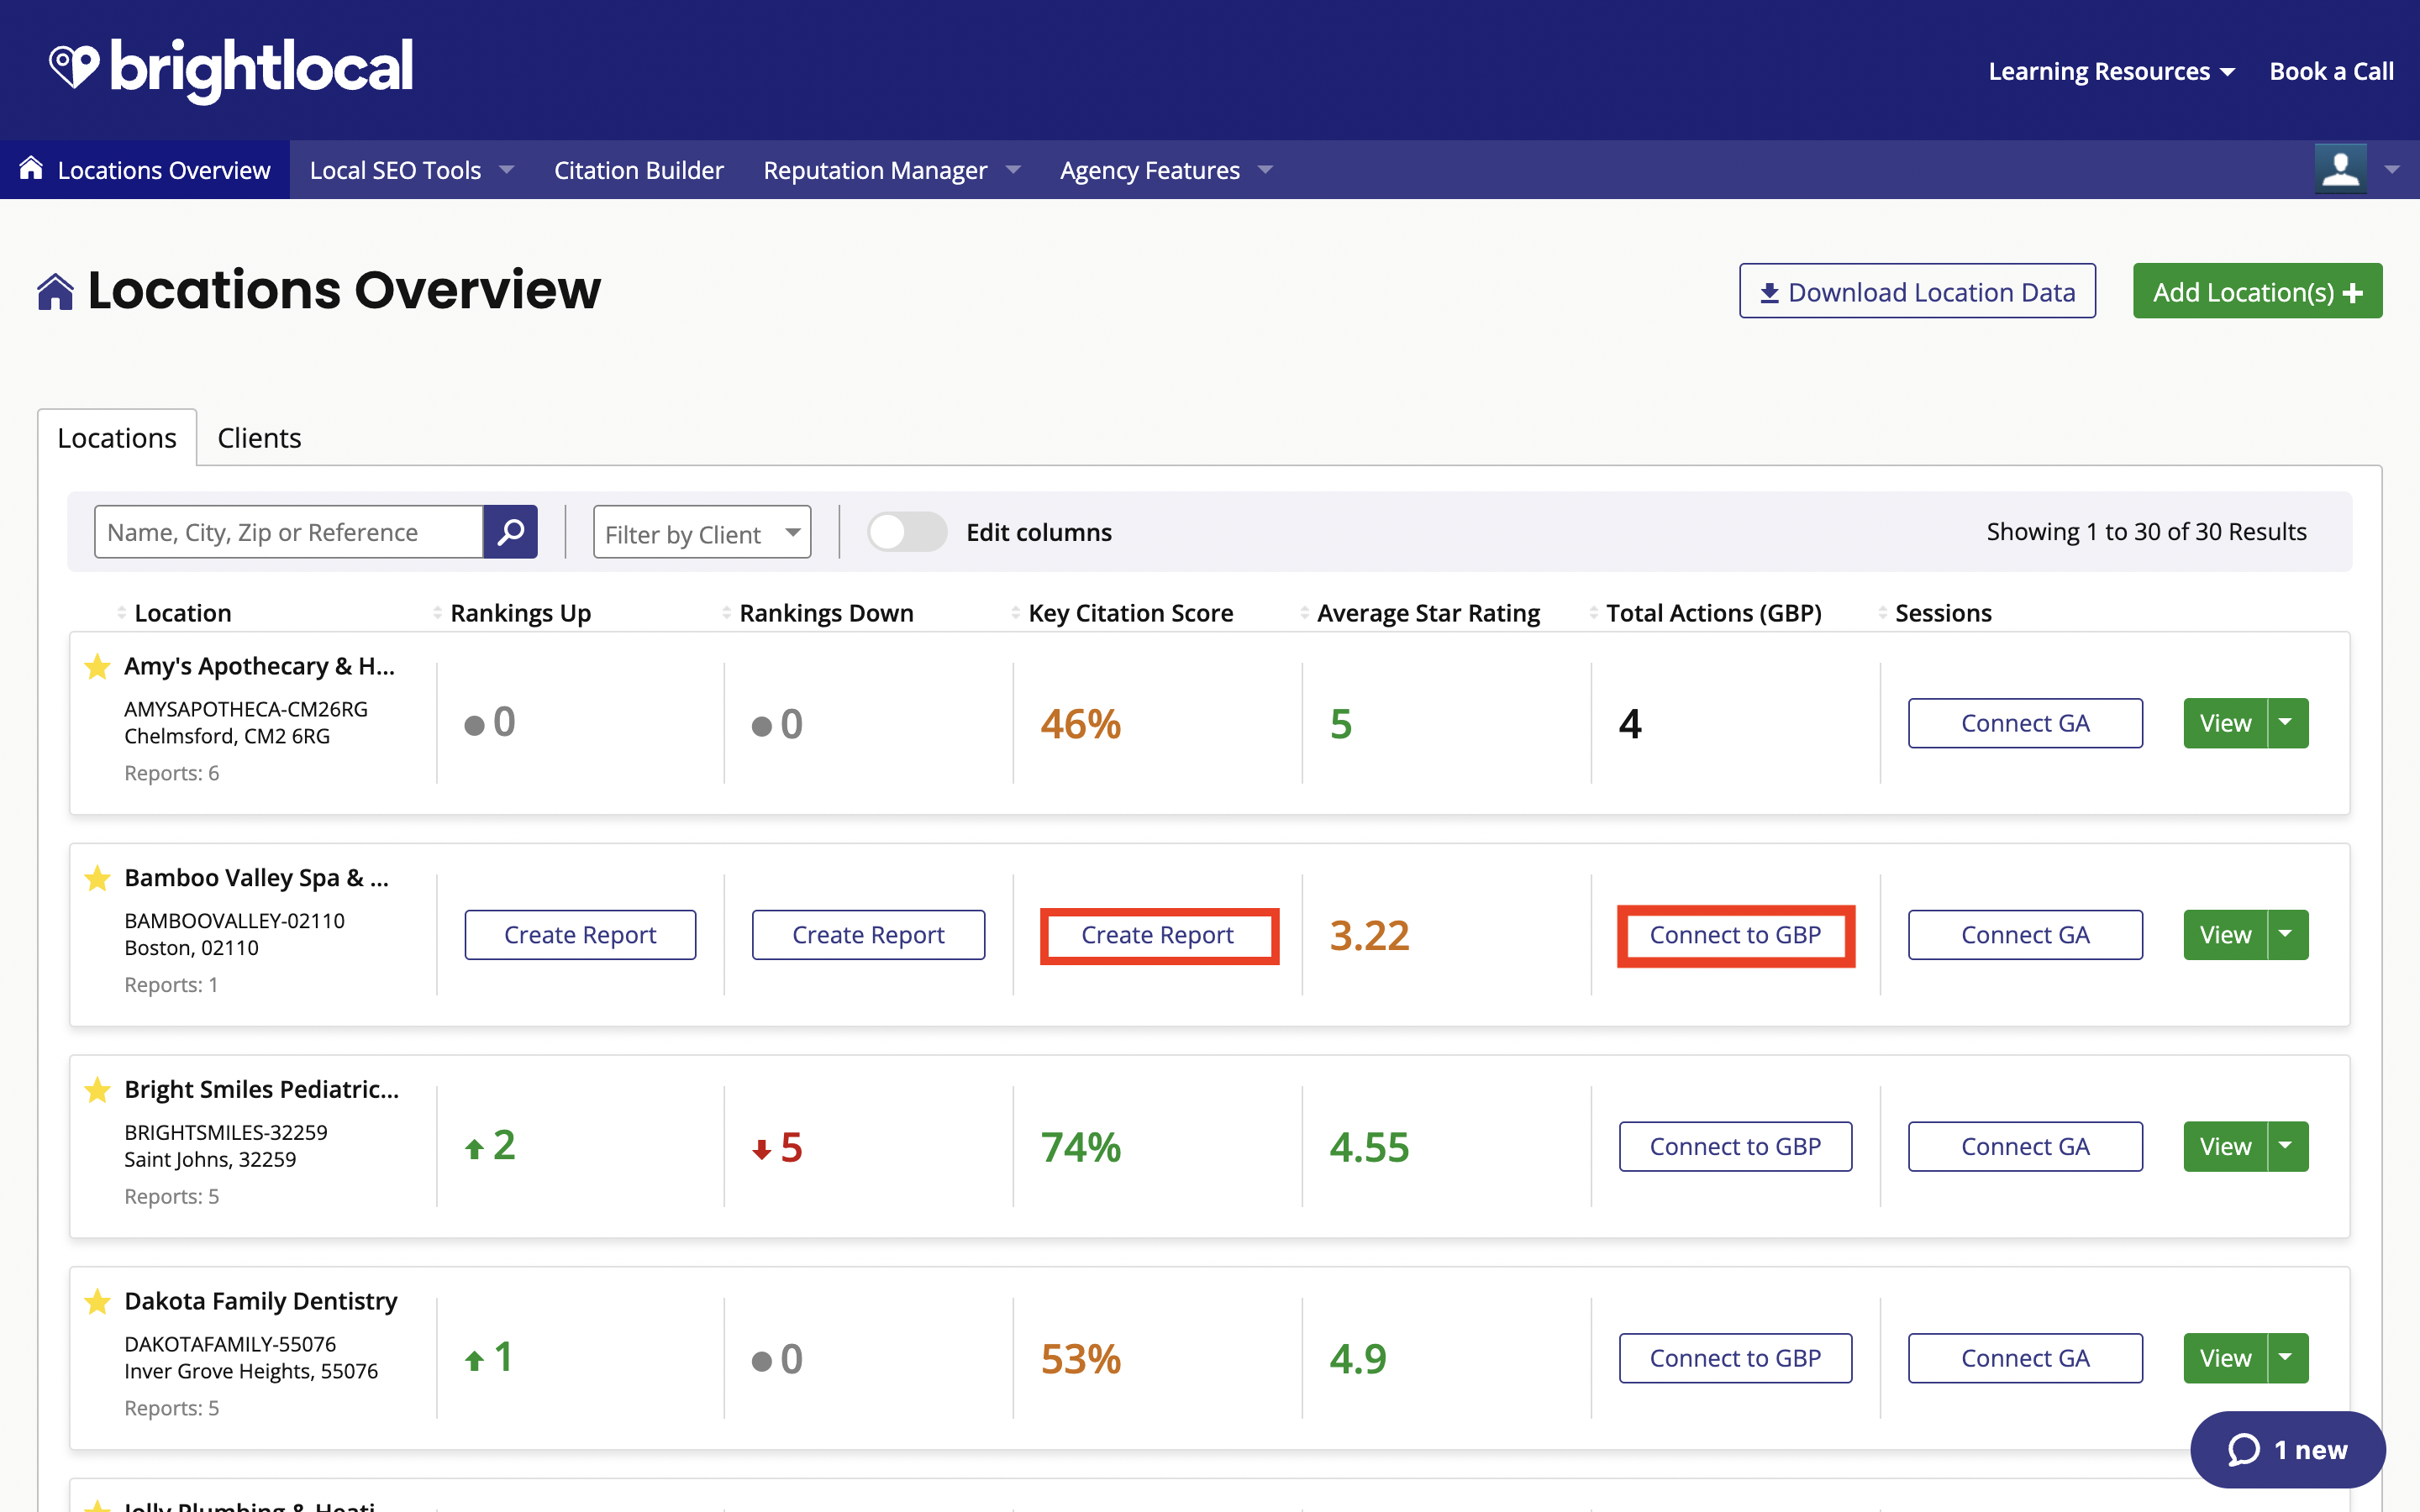
If you haven’t created a report yet for a particular tool but would like to, click the ‘Create Report’ button. Similarly, if you’d like to connect one of your social media accounts to see their data click the appropriate ‘Connect to… ’ button.

Was this article helpful?
That’s Great!
Thank you for your feedback
Sorry! We couldn't be helpful
Thank you for your feedback
Feedback sent
We appreciate your effort and will try to fix the article